What to Make of Strong New Home Sales and Weak Existing Home Sales?
Friday, August 26, 2016 by Zelman & Associates
Filed under: Existing Home SalesNew Home SalesSurvey
For many looking from afar, the release of new and existing home sales in July was likely a bit puzzling. Seasonally-adjusted new home sales, according to the Census Bureau, posted a recovery high and were up 31% year over year. Meanwhile, existing home sales, as reported by the National Association of Realtors, dropped to the second lowest level of the year and were 2% weaker than last year. So what gives?
First, it is always important to realize that “new home sales” are a measure of contracts signed and “existing home sales” reflect the closing of prior contracts. Thus, in theory, there could be a disconnect for a given month. However, we believe that the July confusion is more related to the volatility of the Census Bureau time series and the unusual calendar that resulted in two fewer business days this July than last July.
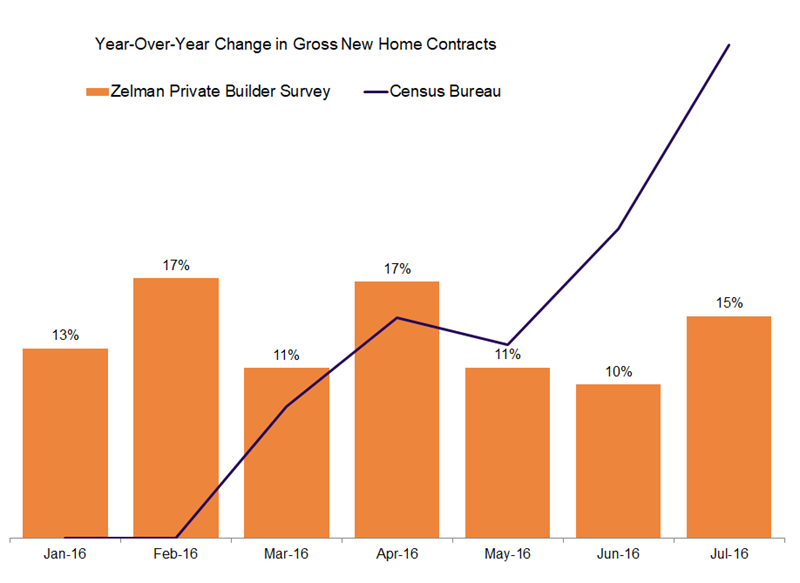
For new home sales, non-seasonally adjusted activity was reportedly up 33% year over year, the strongest increase since January 2013 and leaving the trailing three-month growth rate at 22%. In contrast, based on our research and public builder results, we believe the national production market is expanding at a low double-digit pace. Just like in 1Q16 when our channel checks were outpacing the 3% increase reported by the Census Bureau, we believe that the current growth rates are overstating demand. More telling, year-to-date growth of 13% for the Census Bureau time series is actually identical to the increase reported by the private builders participating in our monthly survey.
For existing home sales, while the seasonally-adjusted pace of 5.39 million in July was down 3% from June, non-seasonally adjusted sales per business day were down 7% sequentially, better than the 10% decline registered on average over the last five years. Given that a two-day business headwind has only occurred four times over the last ten years and in a different month of the year each time, we naturally wonder whether the seasonally-adjusted figure that catches the attention and headlines is the best representation of industry activity. Any discrepancy should be resolved in August as the calendar reverses to a two business-day tailwind.
Friday, August 26, 2016 by Zelman & Associates
Filed under: Existing Home SalesNew Home SalesSurvey
Looking for More Insightful Content?
Explore our ResearchAffordabilityApartmentsBaby BoomersBuild-For-RentBuilding ProductsConstruction LendingConsumerDemographicsEntry-LevelExisting Home SalesHome ImprovementHome PricingHomebuildingHomeownershipHousehold FormationHousingHousing StartsInstitutional InvestorsInterest RatesM&AMacro HousingManufactured HousingMillennialsMortgageMortgage RatesNew Home SalesReal Estate ServicesRefinanceSG&ASingle-Family RentalStocksStudent DebtSupplySurvey