Ends of Income Spectrum Shaping Current Story of Existing Home Sales
Friday, September 23, 2016 by Zelman & Associates
Filed under: Existing Home SalesSurvey
Each month as part of our private homebuilder survey, we ask our contacts to rate new home demand by price point on a 0-100 scale. In August, the entry-level segment was rated at 67.3, representing the strongest of the five price points for the seventh consecutive month. Such consistent relative strength was not witnessed previously since late-2010 and early-2011. At the same time, second-time move-up demand was rated at 62.6, healthy in absolute terms but softer than the prior year at 63.1, which is the only price point to post a negative year-over-year trend.
On the existing home side of the housing market, the same message of strength at the entry-level and greater weakness at high-end price points has been evident, but it creates more work to dissect and quantify by market. In a recent thematic report titled, “A Tale of Two Markets”, we analyzed sales and inventory data across 27 major metropolitan areas. In each market, we segmented the data by four price points: (1) entry-level; (2) first-time move-up; (3) second-time move-up; and (4) luxury. Realizing that pricing breakpoints are varied across markets, this analysis is unique in that it does not group national sales into dollar price points that are not representative of local market dynamics.
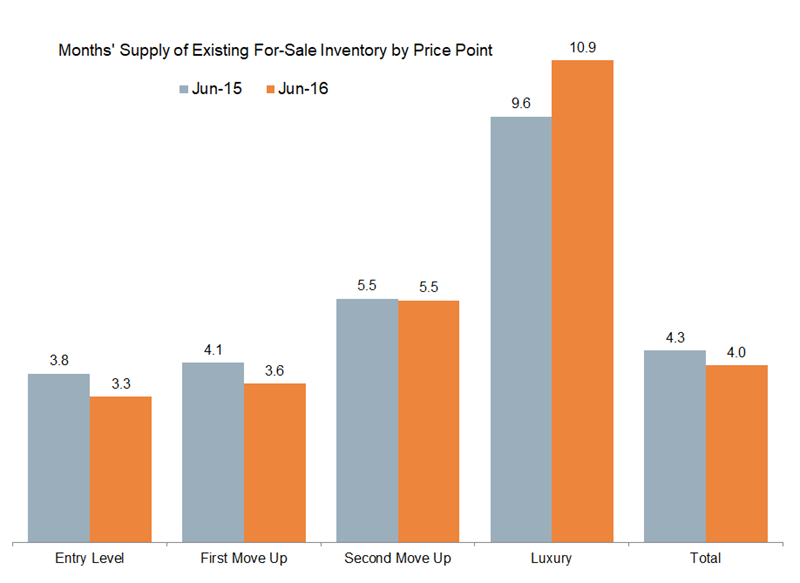
In these 27 markets, 2Q16 existing home sales were up 3% year over year, with the first-time move up and second-time move up segments leading growth at 12% each. On the ends of the spectrum, entry-level sales were down 7% and luxury sales were up only 5%. However, as many real estate agents know, this does not tell the entire story given that sales are dependent on having enough inventory in the right locations and for-sale entry-level listings were down an even greater 19%. When looking at months’ supply of inventory, the entry-level segment was tighter than average at 3.3 months, and importantly, lower than the prior year at 3.8 months. In other words, demand improved when considered in the context of supply. Months’ supply also compressed year over year for the first-time move-up price point to 3.6 months.
Meanwhile, luxury growth and pricing power appear at risk moving forward as months’ supply in 2Q16 of 10.9 was up notably from 9.6 in 2Q15. The second-time move-up segment was more balanced with months’ supply at 5.5 and equal to the prior year, but we are keeping a close eye on the price point out of concern that luxury softness could seep lower on the pricing ladder.
Overall, our analysis left us more cautious on the high end of the market given elevated supply while also realizing that continued strength in existing home sales will be dependent on for-sale inventory rising at lower price points. We believe that increased investment by homebuilders at the entry-level will facilitate such an improvement in listings in the coming years, but we reflect the near-term headwind in our macro housing forecasts. We now project 2016 existing home closings to increase 4%, down from our prior forecast of 5%.
Friday, September 23, 2016 by Zelman & Associates
Filed under: Existing Home SalesSurvey
Looking for More Insightful Content?
Explore our ResearchAffordabilityApartmentsBaby BoomersBuild-For-RentBuilding ProductsConstruction LendingConsumerDemographicsEntry-LevelExisting Home SalesHome ImprovementHome PricingHomebuildingHomeownershipHousehold FormationHousingHousing StartsInstitutional InvestorsInterest RatesM&AMacro HousingManufactured HousingMillennialsMortgageMortgage RatesNew Home SalesReal Estate ServicesRefinanceSG&ASingle-Family RentalStocksStudent DebtSupplySurvey