At this point last year, 30-year fixed mortgage rates were expected to average approximately 4.10% in 2016 and we predicted refinance volumes to decline 30% for the year. Instead, volatile financial markets to begin the year, slowing macroeconomic data and global events such as “Brexit” drove a reversal in interest rates, with a steady downward trend through the election.
Despite near-term upward pressure on interest rates, we estimate that refinance unit originations will increase 7% this year, equaling almost 3.4 million mortgages. According to our analysis, this equates to almost 7% of outstanding owner-occupied mortgages. While most mortgage market analysts reference refinance trends in dollar terms, we find it instructive to first analyze the unit characteristics as home price inflation, equity extraction and loan-to-value ratios have changed through time.
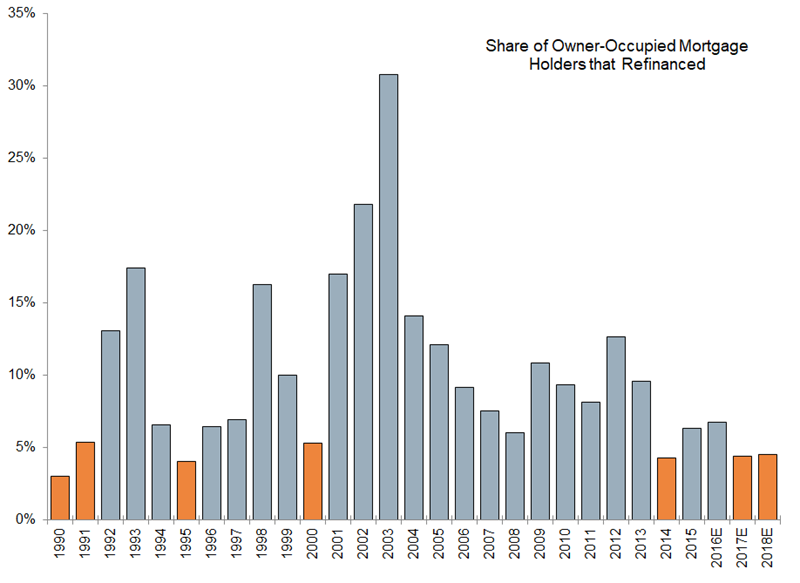
Dating back to 1990, 10% of mortgage holders have refinanced per year, on average, ranging from robust activity in 2002 (22%) and 2003 (31%) to trough environments in 1990 (3%) and 1995 (4%). We believe that this unit perspective is unique and particularly helpful following periods of heavy refinance activity as market participants are most interested in identifying how far it can drop.
At a 30-year fixed rate of 4.15% and an assumed 0.85% rule-of-thumb buffer necessary to justify the cost of refinancing, only mortgage holders with a 5.00% rate or higher would seemingly be “in-the-money”, which at this point is approximately 10% nationally. It therefore stands to reason that non-interest rate factors will comprise the majority of demand in future years. We expect three factors to be most important: (1) conversion from adjustable rates to fixed rates; (2) conversion from higher cost FHA loans to conventional loans; and (3) home equity extraction as price appreciation mounts.
It is very difficult to predict all of these “other” factors collectively, but we know that they have always been present and assume they will continue to be present in future years. Given that prior cycles have troughed at roughly 3-5% of owner-occupied mortgage holders, it implies that the market drop could be 25-55%. For comparison, when we published our macro housing forecasts, we assumed a 33% decline for the year, which already has a downward bias given a subsequent 20 basis point increase in the 10-year Treasury rate since then.
Looking for More Insightful Content?
Explore our ResearchAffordabilityApartmentsBaby BoomersBuild-For-RentBuilding ProductsConstruction LendingConsumerDemographicsEntry-LevelExisting Home SalesHome ImprovementHome PricingHomebuildingHomeownershipHousehold FormationHousingHousing StartsInstitutional InvestorsInterest RatesM&AMacro HousingManufactured HousingMillennialsMortgageMortgage RatesNew Home SalesReal Estate ServicesRefinanceSG&ASingle-Family RentalStocksStudent DebtSupplySurvey