“The” Mortgage Rate Only Covers 20% of Purchase Originations
Friday, January 13, 2017 by Zelman & Associates
Filed under: Mortgage Rates
The cost of mortgage credit is fairly transparent across lenders’ and third-party aggregators’ websites but there are two primary reference points for mortgage rates cited by industry analysts and the media that best summarize the market: weekly surveys conducted by Freddie Mac and the Mortgage Bankers Association (MBA).
Importantly, while we and others typically refer to the 30-year mortgage rate published by both as “the” mortgage rate, there is notable variation based on the underlying characteristics of the loan and borrower. The headline interest rates reported by Freddie Mac and the MBA are specifically tracking quoted contract rates for 30-year fixed conforming mortgages with a 20% downpayment. In other words, the loans are eligible for purchase by Freddie Mac and Fannie Mae, but this excludes loan-to-value mortgages above 80%, those backed by Ginnie Mae (FHA, VA, USDA) and jumbo loans. For perspective, in 2016, 30-year fixed conforming mortgages with at least a 20% downpayment accounted for approximately 20% of total purchase originations.
In 2016, Freddie Mac and the MBA reported an average baseline rate of 3.65% and 3.87%, respectively, with the variance primarily driven by different samples. To better understand the actual rates received by borrowers on originated loans, and to measure the variance based on loan characteristics, we analyzed almost three million securitized purchase loans with a 30-year fixed term that we estimate accounted for approximately 70% of industry-wide originations last year.
According to our analysis, the average contract rate for 30-year mortgages was 3.92% for loans purchased by Fannie Mae and Freddie Mac and 3.78% for those purchased by Ginnie Mae, with the variance attributable to loan-level price adjustments by the GSEs and the FHA rate excluding insurance premiums, partially offset by a higher cost to service Ginnie Mae loans.
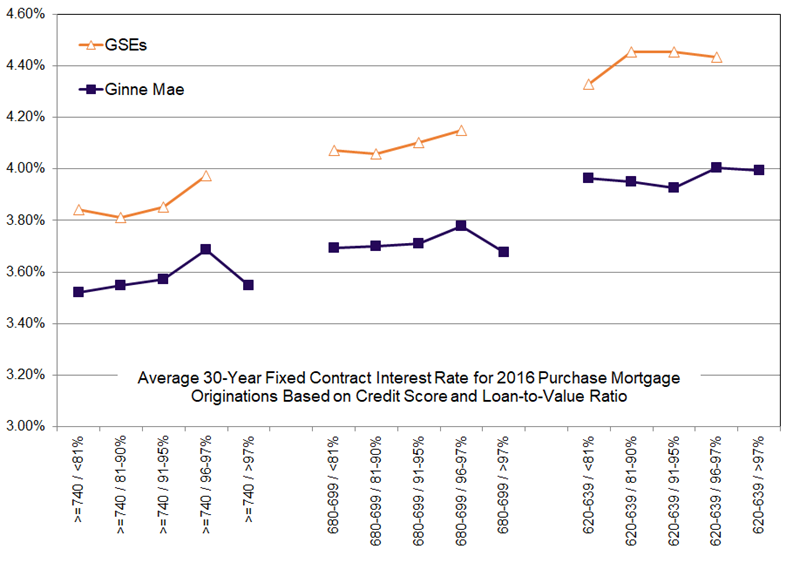
Looking specifically at GSE mortgages, rates averaged roughly 3.85% for the best slice of credit with at least 20% down and a credit score of 740 or higher. On the other hand, the rate averaged approximately 4.35% for mortgages with a credit score of 640-659 or lower. Interestingly, the vast majority of the variance in rate was driven by credit score versus downpayment. For Ginnie Mae purchase mortgages, the safest segment of the market received an average contract rate of roughly 3.50% while the weakest credits were priced closer to 4.15%. These figures more appropriately capture the interest rate being paid by 2016 borrowers.
Friday, January 13, 2017 by Zelman & Associates
Filed under: Mortgage Rates
Looking for More Insightful Content?
Explore our ResearchAffordabilityApartmentsBaby BoomersBuild-For-RentBuilding ProductsConstruction LendingConsumerDemographicsEntry-LevelExisting Home SalesHome ImprovementHome PricingHomebuildingHomeownershipHousehold FormationHousingHousing StartsInstitutional InvestorsInterest RatesM&AMacro HousingManufactured HousingMillennialsMortgageMortgage RatesNew Home SalesReal Estate ServicesRefinanceSG&ASingle-Family RentalStocksStudent DebtSupplySurvey