As Boomers Age in Place, Less Inventory Available For Sale
Friday, February 24, 2017 by Zelman & Associates
Filed under: Baby BoomersDemographicsExisting Home Sales
In 2016, existing home sales increased 4%, which is consistent with the long-term median increase, despite a strong employment backdrop, accelerating household formations and elevated consumer confidence toward housing. Unfortunately, the market was held back by for-sale inventory being down 4% on average through the year, underscoring that supply is an important element to consider when forecasting demand. In that vein, we first summarize the major reasons why households typically move and then analyze how an aging population might impact the future of existing home supply.
According to Census Bureau surveys, the decision to move is heavily influenced by demographic circumstances, changes in employment or shifts in financial resources. For example, over the last 20 years, the most common reasons given for moving were wanting to upgrade the current living situation (28% of total), employment-related such as a job transfer or wanting to live closer to work (20%), establishing an independent household (11%) and other family reasons (10%). Discretionary upgrades or employment-related factors tend to shift with the economic cycle while some household movement occurs regardless of the economic backdrop when non-discretionary reasons such as demographics take over.
Beyond the reason of why someone moves, an important consideration for the housing market is also how often they move. Given that young adults change jobs more frequently, have a less settled family situation and have more fluid financial circumstances, they naturally move more than their elder counterparts.
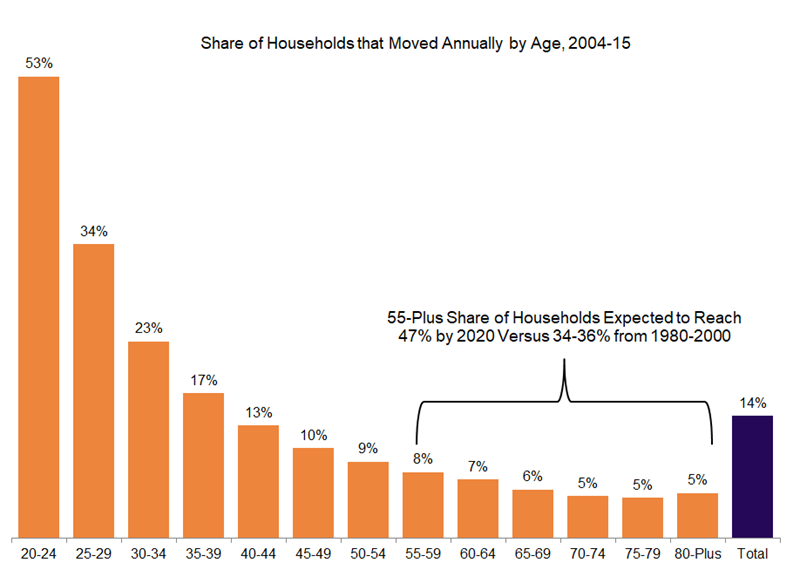
Supporting this statement, over the last 12 years, 14% of households moved per year, on average, with those younger than 40 moving more than average and those 40 or older moving less than average. Said another way, 53% of 20-24 year old households moved on average each year, meaning that they were in their residence for just two years. On the other hand, less than 5% of 75-79 year olds typically move, equating to an average stay of 22 years.
It therefore stands to reason that as the population ages and the share of older households increases, existing home for-sale inventory is likely to face an incremental headwind. For example, in 1980, 1990 and 2000, 55-plus year old households accounted for 34-36% of the total. But that has since increased to 40% in 2010 and 44% in 2015 and we project it to climb further to 47% by 2020.
To put this shift into perspective, if we held the recent share of households moving by age group constant through time, the expected national move rate would drop to roughly 13% by 2020 from 14% in 2010 and 17% in 1980. The change might not appear material on the surface, but it would suggest that normalized sellers in 2020 would be 4% lower than in 2010 and 22% fewer than in 1980.
This dynamic does not alter the number of housing units the country needs, but it is worthy of a place in the conversation because if fewer households are moving due to age reasons, it potentially puts a larger onus on new construction to fill the gap on incremental housing demand.
Friday, February 24, 2017 by Zelman & Associates
Filed under: Baby BoomersDemographicsExisting Home Sales
Looking for More Insightful Content?
Explore our ResearchAffordabilityApartmentsBaby BoomersBuild-For-RentBuilding ProductsConstruction LendingConsumerDemographicsEntry-LevelExisting Home SalesHome ImprovementHome PricingHomebuildingHomeownershipHousehold FormationHousingHousing StartsInstitutional InvestorsInterest RatesM&AMacro HousingManufactured HousingMillennialsMortgageMortgage RatesNew Home SalesReal Estate ServicesRefinanceSG&ASingle-Family RentalStocksStudent DebtSupplySurvey