Housing Executives and Analysts Being Swung Around by Volatile Government Data
Friday, March 10, 2017 by Zelman & Associates
Filed under: Household Formation
Household formation is a phrase used to describe the net change in the number of households over a given period of time, essentially measuring incremental housing demand. Despite the importance of this measure to the housing market, in particular new construction requirements, we believe that the figures provided by the Census Bureau are often misleading.
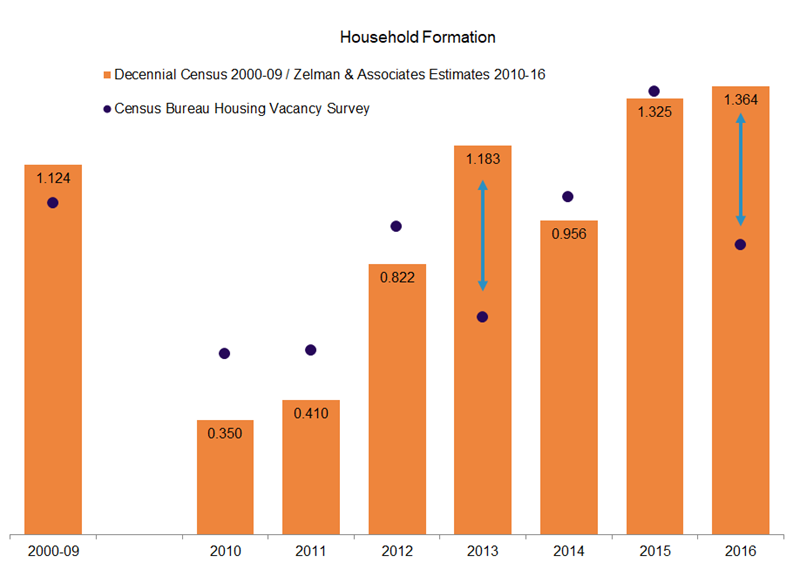
According to the quarterly Housing Vacancy Survey (HVS), the Census Bureau estimates that households expanded by 805,000 year over year in 4Q16, with an average increase through the year of just 880,000. This would be down 35% from 2015 despite favorable housing fundamentals throughout the year that were equal to or stronger than in 2015. Unfortunately, while we have accepted that the household formation figures reported by the government are unreliable, the media, industry executives and investors are forced to cite them because alternatives are limited.
Instead, we combine our proprietary analysis of residential electric customer counts, which benefit from substantially-superior sample sizes and therefore less volatility, with other housing metrics to form independent household formation estimates. Based on our updated analysis including 4Q16 data, we estimate that 1.364 million households were formed in 2016, slightly softer than our 1.461 million estimate as of 3Q16 but still 3% stronger than 1.325 million in 2015 and 38% higher than the 2012-14 average. In other words, our 2016 estimate is 55% higher than that reported by the Census Bureau to which many industry participants are wed without questioning the quality.
In 2016, new construction supply totaled 1.14 million across single-family, multi-family and manufactured housing, up 10% year over year. This marked the fifth consecutive double-digit increase, something that had not happened since the Census Bureau data began in 1968. Of course, the growth occurred from a depressed base after the significant contraction during the Great Recession, but it should not be dismissed given that it underscores the tight inventory environment, in our mind.
Based on our detailed age-specific demographic analysis, we estimate normalized household formation for the current population at roughly 1.3-1.4 million and assume 0.2 million of demand to replace lost stock, resulting in mid-cycle new construction needs of 1.5-1.6 million. Given that 2016 new construction stood roughly 25-30% below this normalized level and excess vacancies have been all but cleared, we believe that there is a clear path for new construction supply to continue expanding at a double-digit clip.
Friday, March 10, 2017 by Zelman & Associates
Filed under: Household Formation
Looking for More Insightful Content?
Explore our ResearchAffordabilityApartmentsBaby BoomersBuild-For-RentBuilding ProductsConstruction LendingConsumerDemographicsEntry-LevelExisting Home SalesHome ImprovementHome PricingHomebuildingHomeownershipHousehold FormationHousingHousing StartsInstitutional InvestorsInterest RatesM&AMacro HousingManufactured HousingMillennialsMortgageMortgage RatesNew Home SalesReal Estate ServicesRefinanceSG&ASingle-Family RentalStocksStudent DebtSupplySurvey