Despite Home Price Strength, Entry-Level Affordability Still Screens Favorably
Friday, June 2, 2017 by Zelman & Associates
Filed under: AffordabilityEntry-LevelHome Pricing
There are numerous home price measures that are provided by the government and private entities, both for free and at a charge, that offer market participants a general understanding of national pricing. Given a very high correlation across the datasets, we aggregate a summary index that incorporates estimates from CoreLogic, Case-Shiller, the Federal Housing Finance Agency and the National Association of Realtors.
According to our index, in 2016, existing home prices increased 5.5% through the year, marking the fifth consecutive year of appreciation being 5.0% or stronger. Despite the average 30-year fixed mortgage rate being almost 45 basis points higher in 1Q17 than 4Q16, pressuring the cost of ownership, home price momentum has even gained some steam thus far in 2017. Specifically, our existing home price index improved 1.6% in 1Q17 from 4Q16, representing the best first quarter performance since 1Q14 and the second best since 1Q05. As a result, year-over-year appreciation stood at 5.9% as of March, the highest level since June 2014.
Also as of 1Q17, we estimate that for-sale existing homes and unsold new construction inventory equated to just 1.5% of households, the lowest figure for the 35 years we have data. For perspective, this stands 35-40% below the average during the 1990s and 2000s, demonstrating the constrained options that potential homeowners have in the marketplace today.
Given our positive outlook on demand in conjunction with this tight supply, we recently raised our forecasts for national home price appreciation to 5.6% in 2017 and 5.1% in 2018, up 80 and 100 basis points respectively. Importantly, while home price appreciation is again expected to outpace income growth and higher mortgage rates are also a cost headwind, we believe that affordability remains quite favorable for the typical entry-level consumer.
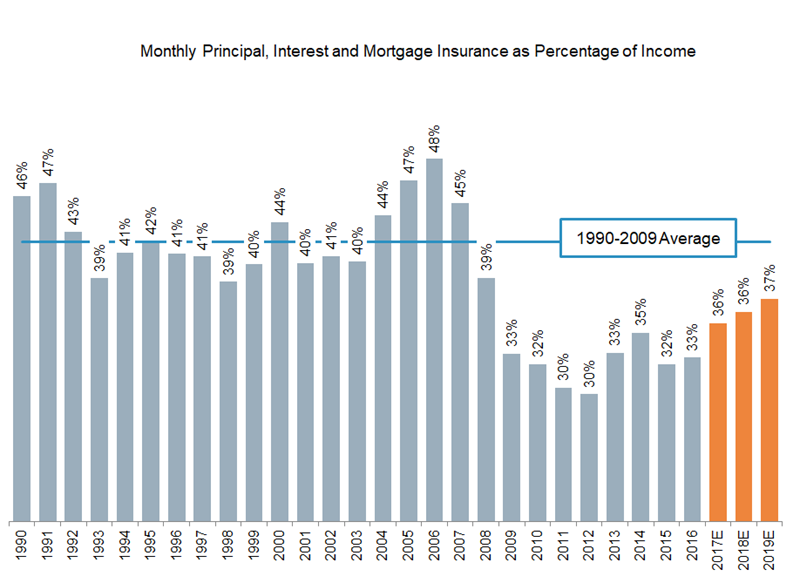
Consider that the median existing home price in 2016 was approximately $200,000, according to CoreLogic, and we expect that to reach roughly $210,000 in 2017. Assuming prevailing mortgage rates and FHA financing, it would cost $1,145 per month for principal, interest and mortgage insurance. While up a material 11% year over year, this would equate to just 36% of annual income for a non-supervisory or production employee – our preferred measure of an entry-level, one-income household.
For comparison, that ratio averaged 42% in the 1990s and 2000s, indicating a substantial buffer to absorb further increases in home prices or financing costs above-and-beyond income growth. Relative to the current 36% ratio, holding all else constant, it would take an approximate 25% increase in home prices or a 30-year mortgage rate of 6.25% to return to the historical average. Overall, we worry more about the perception of affordability constraints and the lack of entry-level inventory than the level of home prices today.
Friday, June 2, 2017 by Zelman & Associates
Filed under: AffordabilityEntry-LevelHome Pricing
Looking for More Insightful Content?
Explore our ResearchAffordabilityApartmentsBaby BoomersBuild-For-RentBuilding ProductsConstruction LendingConsumerDemographicsEntry-LevelExisting Home SalesHome ImprovementHome PricingHomebuildingHomeownershipHousehold FormationHousingHousing StartsInstitutional InvestorsInterest RatesM&AMacro HousingManufactured HousingMillennialsMortgageMortgage RatesNew Home SalesReal Estate ServicesRefinanceSG&ASingle-Family RentalStocksStudent DebtSupplySurvey