A Unique Look at How Single-Family Rental Tenants Differ from Owner Peers
Friday, July 14, 2017 by Zelman & Associates
Filed under: DemographicsHomeownershipSingle-Family Rental
As we have reported previously, there are approximately 16 million single-family rental homes across the country, accounting for almost 35% of all rental properties and clearly standing as a critical component of the housing supply chain. Looking only at the single-family asset class, approximately 81% of homes are owned nationwide and 19% are rented. With nearly one out of every five single-family households opting to rent instead of purchase their home, we dug into various demographic and financial characteristics to help explain some of the factors that drive this decision.
To remove any age bias between owners and renters, we isolate the 30-39 age cohort. For renters, we exclude households paying less than $800 a month or more than $1,600 a month in rent. For owners, we exclude households that own their home free and clear of mortgage debt. These adjustments are meant to exclude the extreme ends of the income spectrum. For background, our filtered analysis covers almost nine million single-family households with 82% of them owned.
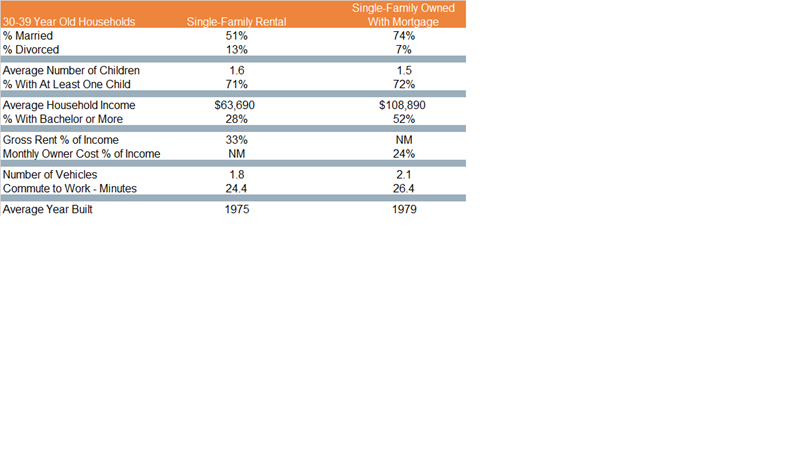
We break our analysis into three major categories: (1) demographics; (2) finances; and (3) location. Starting with demographics, owners are more likely to be married at 74% of the total versus 51% for renters. The divorce rate is almost double for renters (13%) versus owners (7%). While a notable difference exists in marital status, the number of children in the household was consistent at 1.6 on average for renters versus 1.5 for owners.
Financially, as might be expected, owners are on sounder footing, partly due to the aforementioned marital status and also due to educational attainment. For example, the average household income of 30-39 year old single-family owners was almost $109,000 versus $63,700 for renters. Most of the income gap can be explained by 52% of owners having a bachelor’s degree or higher versus just 28% for renters. As a result, despite the additional financial burden of homeownership in the form of property taxes, insurance and in some cases utilities, owners devoted just 24% of gross income to monthly ownership costs versus renters in our analysis spending almost 33% of gross income on rent.
With respect to location, owners have sacrificed commute time for the American Dream, commuting an average of 26 minutes to work versus 24 minutes for single-family renters. With the average rental home built in 1975 versus 1979 for the owned properties, it also suggests that these rental homes are in older communities, closer to the employment centers, all else equal. Along with greater income flexibility, this might also be why owners tend to have more vehicles (2.1) than renters (1.8).
Overall, while there remains a healthy debate about the normalized homeownership rate and the propensity of young adults to choose homeownership as compared to prior generations, we continue to believe that homeownership is first and foremost tied to income. There are exceptions of high-income households that opt to rent by choice or temporarily due to family or work circumstances, but by and large, the data support that financial wherewithal is the single greatest point of differentiation between renters and owners of similar demographic profiles.
Friday, July 14, 2017 by Zelman & Associates
Filed under: DemographicsHomeownershipSingle-Family Rental
Looking for More Insightful Content?
Explore our ResearchAffordabilityApartmentsBaby BoomersBuild-For-RentBuilding ProductsConstruction LendingConsumerDemographicsEntry-LevelExisting Home SalesHome ImprovementHome PricingHomebuildingHomeownershipHousehold FormationHousingHousing StartsInstitutional InvestorsInterest RatesM&AMacro HousingManufactured HousingMillennialsMortgageMortgage RatesNew Home SalesReal Estate ServicesRefinanceSG&ASingle-Family RentalStocksStudent DebtSupplySurvey