With Limited New Home Price Data, Where Do Prices Really Stand Versus Peak?
Friday, July 14, 2017 by Zelman & Associates
Filed under: AffordabilityHome PricingNew Home Sales
There are various price indices that track existing home trends with sophisticated algorithms that rely on repeat sales transactions to produce high-quality datasets, including CoreLogic, Case-Shiller, the Federal Housing Finance Agency and Black Knight, to name a few. The indices are widely cited and often convey very similar results, substantiating their reliability.
However, accurately analyzing new home prices is much more challenging, given the lack of a prior comparison, a smaller share of transactions and variances in geographic and price point mix. Unfortunately, the most-cited measure of new home pricing is the median sales price reported by the Census Bureau. In May, this figure reached an all-time high of $345,800, an astounding 32% higher than the prior cycle peak in March 2007.
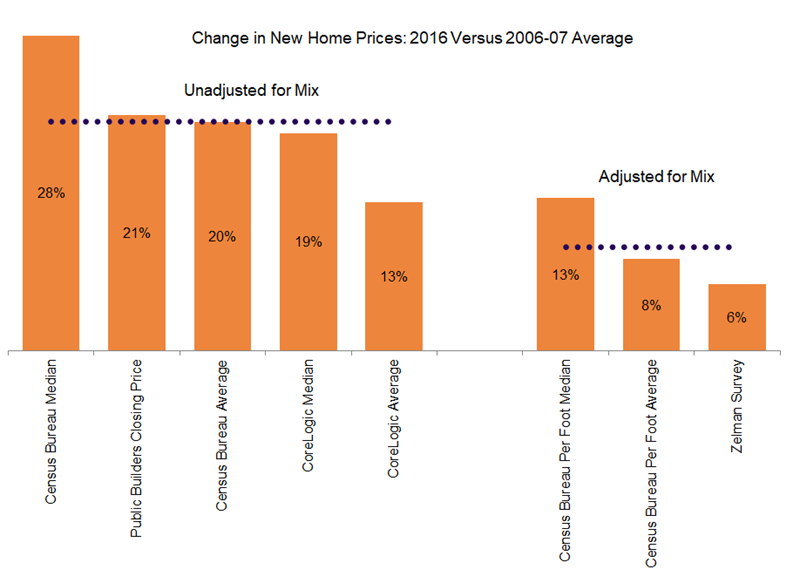
We believe that the simplicity of this measure has led to many alarming media headlines without acknowledgment of the nuances. To more precisely frame the direction of new home prices over the last decade, we analyzed eight different data series sourced from our proprietary monthly survey of private homebuilders, public builder results, the Census Bureau and CoreLogic. For each of these data sets, the annual peak in prices last cycle was either in 2006 or 2007, so we compared 2016 to the average of these two years for the closest comparability.
There are five datasets reported on a mean or median basis that average to a 20% increase from 2006-07 through 2016, with the Census Bureau median showing the most appreciation at 28% and the CoreLogic average the least at 13%. For comparison, our private homebuilder survey price index increased just 6% and the average (8%) and median (13%) per square foot figures for the Census Bureau were also much less inflationary. These three figures average to just 9%, less than half the first grouping.
Homebuilders are finally returning to smaller homes given consistent strength in the entry-level price point, but this is only partly unwinding a shift in prior years to move-up price points in more desirable locations as builders were investing in land assets in a risk-averse manner. Thus, any price index unadjusted for price point mix, overstates apples-to-apples price appreciation – and unfortunately, these are the most-frequently quoted measures!
In reality, we believe that the price of new construction has indeed surpassed the prior peak driven by higher costs of land and materials and limited supply across the country. But we do not view the order of magnitude conveyed by the Census Bureau to be an accurate measure of comparability. We think it is more relevant that the median price per square foot over the last 20 years has increased 2.8%, almost identical to the 2.9% per year gain in entry-level incomes. Said shortly, any gap between income growth and new home construction prices can entirely be explained by these homes being larger.
Friday, July 14, 2017 by Zelman & Associates
Filed under: AffordabilityHome PricingNew Home Sales
Looking for More Insightful Content?
Explore our ResearchAffordabilityApartmentsBaby BoomersBuild-For-RentBuilding ProductsConstruction LendingConsumerDemographicsEntry-LevelExisting Home SalesHome ImprovementHome PricingHomebuildingHomeownershipHousehold FormationHousingHousing StartsInstitutional InvestorsInterest RatesM&AMacro HousingManufactured HousingMillennialsMortgageMortgage RatesNew Home SalesReal Estate ServicesRefinanceSG&ASingle-Family RentalStocksStudent DebtSupplySurvey