Do You Realize the Unreliability of Widely-Cited Construction Spending Statistics?
Friday, October 6, 2017 by Zelman & Associates
Filed under: Home ImprovementMacro HousingSurvey
Every month, the Census Bureau publishes The Value of Construction Put in Place Survey, which is intended to provide monthly estimates of the total dollar value of construction work done in the United States. As it relates to the residential market, it includes the construction of new structures and improvements to existing structures.
Separately, the Bureau of Economic Analysis (BEA) publishes quarterly estimates for investment in residential structures, also including new construction and improvements to existing homes such as additions, alterations and major structural replacements. This is a portion of gross domestic product (GDP).
These two data sets are widely referenced by the news media, financial analysts and investors but we find that the attention far outweighs the reliability. In our opinion, not only do the data often provide a misleading conclusion on end demand, but they frequently do not even offer the same directional message.
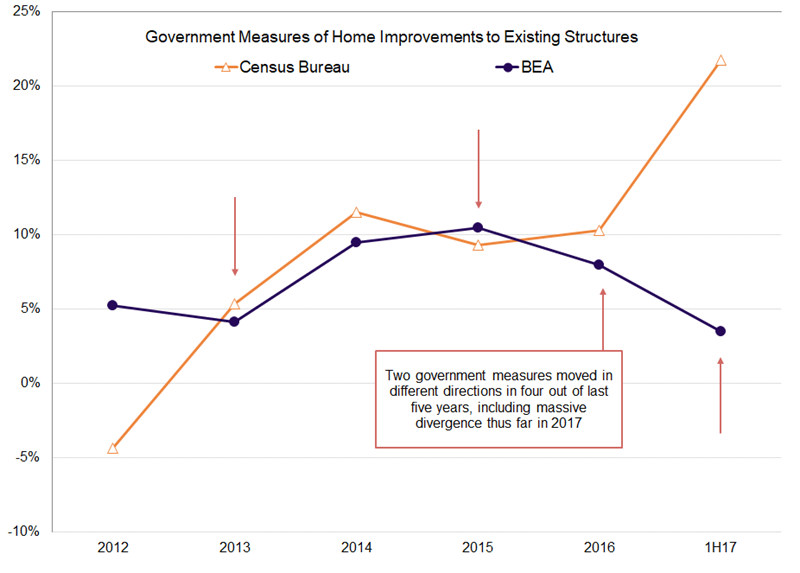
For improvements to residential structures – interpreted by many as big-ticket home improvement expenditures – the Census Bureau reported year-to-date growth through August of 22%, marking sharp acceleration from 10% in 2016 and on pace for the second strongest annual increase of the last 25 years. On the other hand, the BEA has reported just 4% year-over-year growth through 1H17, decelerating from 8% in 2016 and the weakest annual pace since 2010.
Over the last five years, the implied acceleration or deceleration in growth tracked by the two data sets moved in the same direction only once, in 2014. We often pick on government data and the unreliability largely because we continue to see industry executives and investors cite the measures without properly understanding the limitations. Make no mistake, these measures are not marginal releases by the government. They flow into GDP, the highest measure of economic success for many, impacting economic and investment policy along the way, and yet they do not even concur on the conclusion!
One trademark of our research process is an unwillingness to accept data at face value as these types of limitations are unfortunately common. Instead, we rely heavily on our expansive survey of industry executives, wed with our macro and company-specific analyses to form well-educated opinions. As an example, our tracking of home improvement expenditures via our monthly survey of building products manufacturers and distributors, married with our analysis of other data led our updated estimate for national home improvement spending growth of 5.3% in 2017. This is identical to our estimate of growth in 2016, which we believe is a pure reflection of the market versus the aforementioned government statistics.
Friday, October 6, 2017 by Zelman & Associates
Filed under: Home ImprovementMacro HousingSurvey
Looking for More Insightful Content?
Explore our ResearchAffordabilityApartmentsBaby BoomersBuild-For-RentBuilding ProductsConstruction LendingConsumerDemographicsEntry-LevelExisting Home SalesHome ImprovementHome PricingHomebuildingHomeownershipHousehold FormationHousingHousing StartsInstitutional InvestorsInterest RatesM&AMacro HousingManufactured HousingMillennialsMortgageMortgage RatesNew Home SalesReal Estate ServicesRefinanceSG&ASingle-Family RentalStocksStudent DebtSupplySurvey