What to Learn from Where Older Cohorts are Living, Moving?
Friday, October 6, 2017 by Zelman & Associates
Filed under: Baby BoomersDemographics
Baby boomers are accepted as the generation born from 1946-64. There were approximately 76 million births during these years, which was a robust 53% higher than the 19 years prior given overall population growth, the effects of the Great Depression and World War II. From a housing perspective, the significance of the baby boomer cohort has always been their substantial size relative to the preceding generation, in our opinion.
To help answer the question more broadly about shifting living choices of older cohorts, we analyzed the 55-75 age cohort with respect to geographic concentration and destination upon move. The group totals roughly 72 million strong today and controlled 34% of total households in 2016.
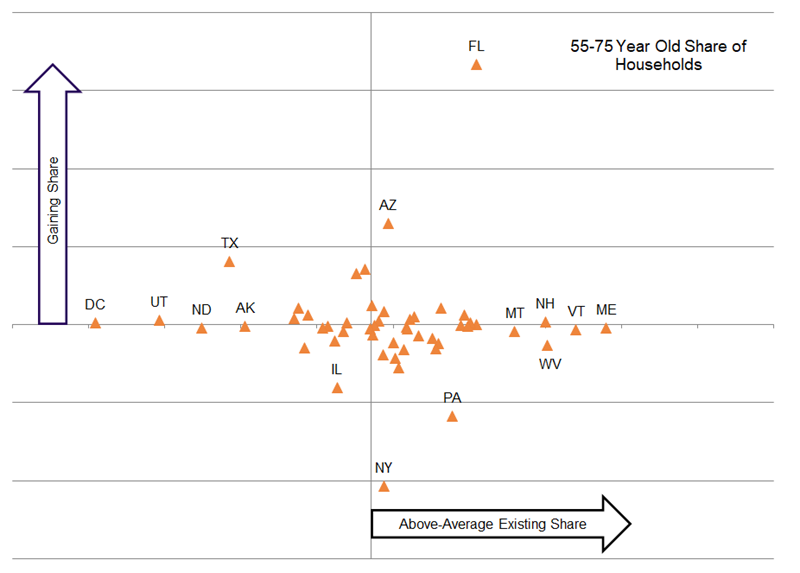
At the state level, the household share of 55-75 year olds ranged from Maine at 41% to Utah at 29%. For the five states with the largest absolute number of 55-75 year old households, Florida (37%), Pennsylvania (37%) and New York (35%) were above average while California (33%) and Texas (31%) were below average.
Recognizing that some areas, like Florida, have traditionally had a higher share of retirees, we separately analyzed activity of recent movers to understand if geographic preference has been shifting. For instance, across the country, 6.5% of 55-75 year olds moved in 2015, including both owners and renters. This ranged from Nevada at 11% to West Virginia at 4%. Put another way, Nevada gained “market share” of incremental 55-75 year old movers while West Virginia lost.
As we look across the country, destinations gaining share as measured by the spread between the percentage of movers and the percentage of households were led by Florida, Arizona, Texas, Nevada and Washington at the expense of New York, Pennsylvania, Illinois, New Jersey and Massachusetts. There are only 12 states that have the best of both worlds – a higher than average share of 55-75 year old households that is also rising – including Arizona, Arkansas, Delaware, Florida, Missouri, North Carolina, New Hampshire, New Mexico, Oklahoma, Oregon, South Carolina and Tennessee. As a result, we suspect that the markets within these states are likely to witness a disproportionate demand benefit for new and existing homes among this cohort.
Friday, October 6, 2017 by Zelman & Associates
Filed under: Baby BoomersDemographics
Looking for More Insightful Content?
Explore our ResearchAffordabilityApartmentsBaby BoomersBuild-For-RentBuilding ProductsConstruction LendingConsumerDemographicsEntry-LevelExisting Home SalesHome ImprovementHome PricingHomebuildingHomeownershipHousehold FormationHousingHousing StartsInstitutional InvestorsInterest RatesM&AMacro HousingManufactured HousingMillennialsMortgageMortgage RatesNew Home SalesReal Estate ServicesRefinanceSG&ASingle-Family RentalStocksStudent DebtSupplySurvey