Questions Arise as Residential Investment in GDP Hits Softest Growth Since 2Q11
Friday, November 3, 2017 by Zelman & Associates
Filed under: Macro Housing
Last week, the Bureau of Economic Analysis (BEA) released its preliminary estimate of 3Q17 GDP growth. As measured directly, investment in residential structures is on pace to average approximately $730 billion this year, accounting for almost 4% of economic activity.
According to the government, 3Q17 residential investment increased just 5% year over year in nominal terms, only modestly ahead of a 4% increase for the overall economy. For residential investment, the absolute level of growth and the differential versus overall GDP was the softest since 2Q11. Year to date, 6% growth in residential investment across the four major subcategories was as follows: single-family new construction up 9%; brokers’ commissions, driven largely by existing home closings, up 7%; multi-family new construction up 4%; and structural home improvements up 3%. As we will detail further below, we believe the government is understating growth in all four areas.
For single-family new construction, we note that starts, units under construction and completions have all increased 8-9% thus far in 2017. Assuming a modest offset from average square footage with a shift toward entry-level product and a conservative 4% increase in construction costs, would suggest that year-to-date growth should be closer to 12% than 9%.
For multi-family, while starts are down 8% thus far this year, units under construction (up 8%) and completions (up 15%) remain higher than the prior year with rising construction costs also compounding those unit measures. As such, our bottoms-up estimate of investment in new multi-family construction is closer to 8% than 4% by the government.
Lastly, based on our proprietary monthly survey of building products manufacturers and distributors, results from home improvement retailers such as Ace Hardware, Lowe’s and The Home Depot, and other publicly-available data, we estimate that overall home improvement expenditures have increased approximately 5% thus far in 2017. This compares to sub-3% growth estimated by the BEA, which is even more peculiar given that the government is attempting to track bigger-ticket structural improvements that tend to outperform at this point in the cycle.
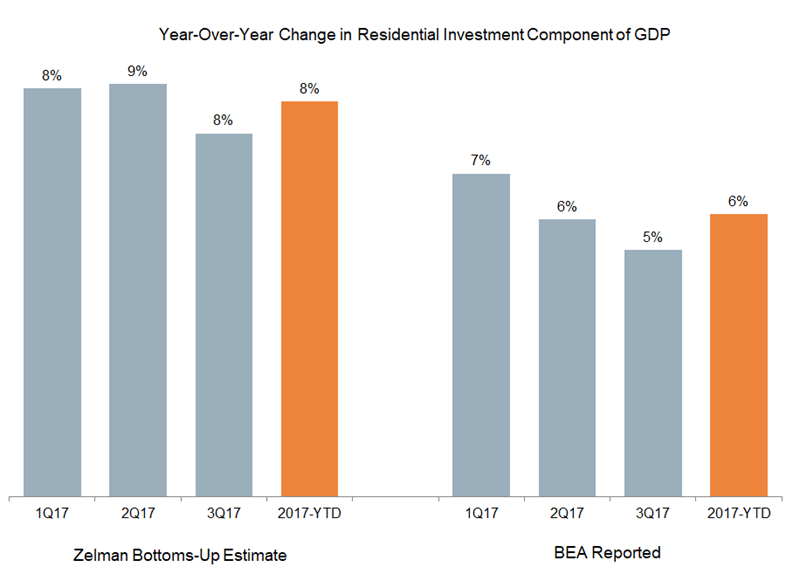
Although our roll-up of existing home closings and price, which drives brokers’ commissions, implies slightly higher growth (8%) than the BEA data (7%), the variance is relatively small. All told, when we aggregate our bottoms-up analysis across the four primary components of residential investment, we believe that year-to-date underlying spending is expanding approximately 8% versus the 6% reported by the BEA. Furthermore, the delta has widened through the year, with our growth estimate consistent at 8-9% for the three quarters while the government’s measure has decelerated from 7% in 1Q17 to 5% in 3Q17.
Assuming our analysis is a better reflection of residential investment spending and the year posted 8% growth, it is still certainly not heroic, but it would have a chance at reaching the 9% growth posted in 2016 and remains underpinned by double-digit growth in single-family new construction where inventory constraints are most pronounced.
Friday, November 3, 2017 by Zelman & Associates
Filed under: Macro Housing
Looking for More Insightful Content?
Explore our ResearchAffordabilityApartmentsBaby BoomersBuild-For-RentBuilding ProductsConstruction LendingConsumerDemographicsEntry-LevelExisting Home SalesHome ImprovementHome PricingHomebuildingHomeownershipHousehold FormationHousingHousing StartsInstitutional InvestorsInterest RatesM&AMacro HousingManufactured HousingMillennialsMortgageMortgage RatesNew Home SalesReal Estate ServicesRefinanceSG&ASingle-Family RentalStocksStudent DebtSupplySurvey