Americans Moving at Slowest Pace in History – What is True Housing Takeaway?
Friday, December 15, 2017 by Zelman & Associates
Filed under: DemographicsHomeownership
According to a recent study released by the Census Bureau, 11.0% of the U.S. population moved in the year ended 1Q17. The study refers to this as the “mover rate” and notes that the latest reading was lower than 11.2% in the prior year, which was already a historic low. Although the underlying data is correct, we struggle with the utility of the message for two reasons.
First, it looks at the population versus households, so a family of six impacts the metric more than a family of four even though the housing impact is virtually the same. Second, it does not adjust for a shift in the mix of ages over time. With older households naturally moving less frequently than younger cohorts and the average age of the population increasing each of the last 53 years, there should be a natural downtrend in this ratio.
Looking only at households as defined by just-released American Community Survey results, we calculate that 13.0% moved in 2016, down from 13.2% in 2015 and well below the near-term peak of 15.6% in 2005. However, in 2016, 35% of households were at least 60 years old, up substantially from 27% in 2005, creating an apples-and-oranges comparison. If we instead held the 2016 household composition steady through time for the best comparability, the national mover rate would have been virtually unchanged over the last ten years. It would have been either 13.0% or 13.1% in each of the last six years and outside 12.8-13.1% only once over this decade at 12.5% in 2009.
Recognizing that numerous factors influence whether a household decides to move or not, including the cost of housing, family circumstances, changes in employment or more discretionary reasons, we are most focused on how behavior is changing or not for households that reach this decision point. More specifically, have movers been more or less likely to purchase than in the recent past?
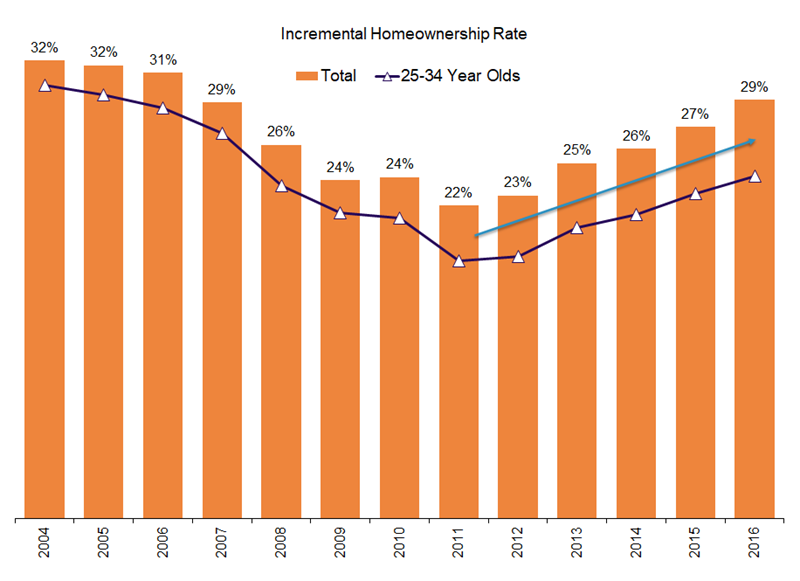
For example, 33% of 25-29 year old households moved in 2016 and, of these households, 20% purchased their next home. We refer to this as the incremental homeownership rate and believe it is a telling data point as it describes the desire to own or rent at a specific instance in time versus an accumulation of decisions over numerous years. For this age cohort, this was the highest incremental homeownership rate since 2007 and the fourth consecutive year that it increased.
In fact, we calculate that the incremental homeownership rate increased in 2016 for each of the 13 summary age cohorts from 20-24 year olds through 80-plus years old. In aggregate, the 2016 incremental homeownership rate was 29%, up from 27% in 2015 and a cycle trough of 22% in 2011. The ratio now stands at the highest level since 2007 and given the improvement in overall homeownership rates thus far in 2017, we believe it is a safe assumption that this momentum has continued this year.
Although limited for-sale inventory continues to constrain overall transaction volume and is likely keeping many households that would prefer to own in the renting camp for the time being, based on our analysis of movers, it appears clear that the appetite for homeownership is on a cyclical upswing.
Friday, December 15, 2017 by Zelman & Associates
Filed under: DemographicsHomeownership
Looking for More Insightful Content?
Explore our ResearchAffordabilityApartmentsBaby BoomersBuild-For-RentBuilding ProductsConstruction LendingConsumerDemographicsEntry-LevelExisting Home SalesHome ImprovementHome PricingHomebuildingHomeownershipHousehold FormationHousingHousing StartsInstitutional InvestorsInterest RatesM&AMacro HousingManufactured HousingMillennialsMortgageMortgage RatesNew Home SalesReal Estate ServicesRefinanceSG&ASingle-Family RentalStocksStudent DebtSupplySurvey