National Mortgage Debt Climbing Again but Leverage Healthier than You’d Think
Friday, December 29, 2017 by Zelman & Associates
Filed under: Macro HousingMortgage
According to the Federal Reserve Bank of New York’s (FRBNY) quarterly report on household debt and credit, residential mortgages accounted for 71% of outstanding liabilities in 3Q17, far surpassing student loans (10%), auto loans (9%) and credit cards (6%). Therefore, it stands to reason that understanding consumers’ willingness to accumulate and ability to afford this debt is a material input for the overall housing market.
As of 3Q17, the FRBNY reported that residential mortgage debt increased 4.2% year over year, accelerating for the fourth consecutive quarter and representing the largest year-over-year gain since 3Q08. Separately, the Flow of Funds produced by the Federal Reserve similarly estimated that outstanding mortgage debt increased at the fastest pace since 2Q08. Both measures indicate that consumers’ mortgage borrowings have been on a steady upward climb since 1Q15, raising the question of whether the housing recovery’s continued momentum is on the back of incremental leverage.
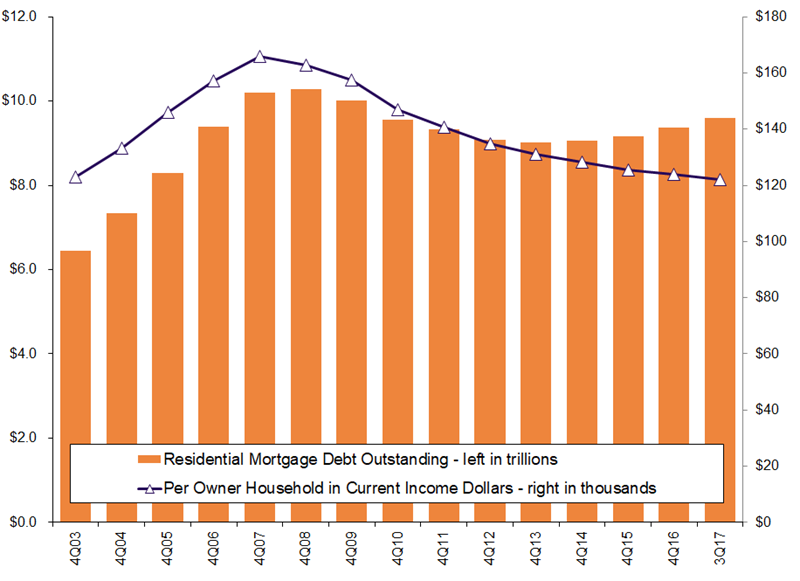
To answer this question, we analyzed outstanding mortgage debt relative to national owner-occupied households and also accounted for the strength of consumers’ purchasing power, as measured by entry-level income growth. For starters, outstanding residential mortgage debt approximated $9.6 trillion as of 3Q17, on par with 4Q10 and only 7% below the historical year-end peak posted in 2008. As measured against owner-occupied households, this equates to $122,000 today versus a peak of $132,400 in 4Q08.
However, over this approximate nine-year period, while income growth has been constrained by the recession and its lingering effects, the compounding factor is still relevant. Specifically, since 2008, income growth has averaged 2.3% per year for an aggregate increase of 22%. These figures are important because if we calculate residential mortgage debt per owner household and recognize that despite subpar income growth, small amounts compound meaningfully over time, a different leverage message results.
If we frame outstanding mortgage debt per owner household in current dollar terms, the $122,000 average in 3Q17 would be lower than every year since at least 2002 and still 26% below the 2007 peak of $165,900 in equivalent terms. Given the excessive borrowing that occurred during the housing bubble, we would expect leverage to remain below those levels but even beyond that comparison, we are encouraged that overall borrowings appear under control. For 2018, we expect this ratio to increase modestly as healthy household formation, a rising homeownership rate and still-strong home price appreciation outpace modest income growth.
Friday, December 29, 2017 by Zelman & Associates
Filed under: Macro HousingMortgage
Looking for More Insightful Content?
Explore our ResearchAffordabilityApartmentsBaby BoomersBuild-For-RentBuilding ProductsConstruction LendingConsumerDemographicsEntry-LevelExisting Home SalesHome ImprovementHome PricingHomebuildingHomeownershipHousehold FormationHousingHousing StartsInstitutional InvestorsInterest RatesM&AMacro HousingManufactured HousingMillennialsMortgageMortgage RatesNew Home SalesReal Estate ServicesRefinanceSG&ASingle-Family RentalStocksStudent DebtSupplySurvey