As Most Tax Payers Benefit from Tax Cuts, Where are the Losers?
Friday, January 12, 2018 by Zelman & Associates
Filed under: Macro Housing
According to The Joint Committee on Taxation, the Tax Cuts and Jobs Act is expected to reduce taxes by approximately $135 billion in 2018 and $280 billion in 2019. For the two years on a combined basis, almost 65% of the savings are projected to be realized by households through individual tax returns with the remainder flowing through to corporations.
For individuals, there are numerous moving pieces within the legislation that positively and negatively influence effective tax rates, including changes in personal tax brackets, marginal tax rates, deductions, credits, exemptions and the alternative minimum tax calculation. From our perspective, there is too much attention on the individual components of change versus the collective impact, particularly for itemized deductions around state and local taxes, property taxes and mortgage interest that tie indirectly to housing. Shouldn’t the focus be on net income or the final effective tax rate? Is the manner in which it is calculated relevant?
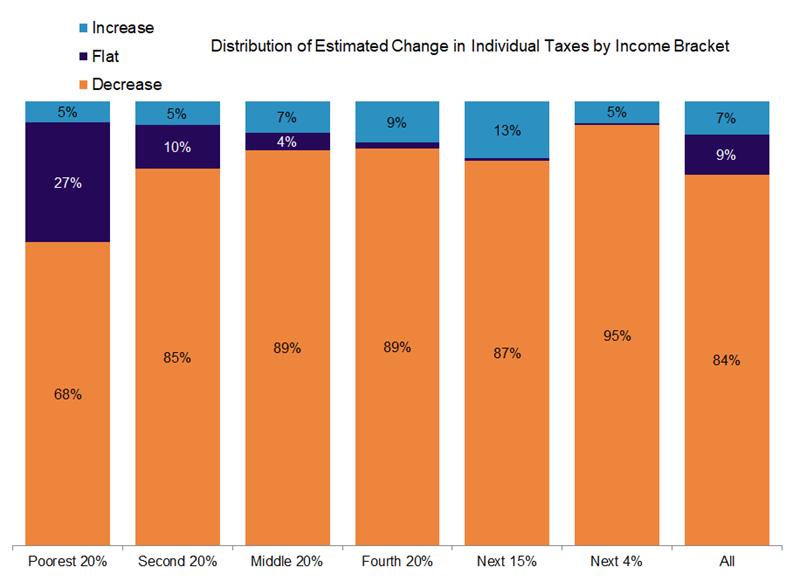
To us, homeownership is a discretionary consumer good that is extremely highly correlated with income. Thus, if net income goes up or down, homeownership should be similarly impacted. According to an analysis by the bi-partisan Institute on Taxation and Economic Policy, the average individual tax filer is projected to experience a 1.5% improvement in after-tax income. On the bookends, the poorest 20% of filers are estimated to see their income rise by 0.7% while the richest 95-99% are projected to benefit by 2.8%. The richest 1% and the other 75% of the income distribution are expected to receive a slightly below-average benefit of 1.1-1.2%. Framed another way, 84% of tax filers are estimated to receive a reduction in taxes paid, and therefore an increase in net cash flow, with middle-income brackets slightly higher around 89%.
As it relates to the national housing market, the fact that net income is improving for the vast majority of households is the most important conclusion. However, we recognize that there is another side to that coin for a small minority of households. Across all income brackets, an estimated 7% of tax filers are likely to see taxes increase under the new law. This is led by approximately 13% in the 80-95th highest income percentile where the average income is roughly $155,000. The share likely to face an increase in taxes shrinks among lower income brackets with only 5% of the poorest quintile expected to pay higher taxes.
However, there is more material variance at the state level due to different usage of itemized deductions. Across all income brackets, an above-average share of tax filers are set to see an increase in taxes in New York (13%), the District of Columbia (12%), Maryland (12%), New Jersey (11%) and California (11%). The potential risk is even more pronounced when looking at the 80-95th percentile income bracket. For these higher-income tax filers, the 13% expected to see taxes increase are led by New York (27%), California (25%), Maryland (24%), New Jersey (21%) and Oregon (20%).
In housing sub-markets that overlap these disadvantaged tax payers, we believe that there is justification for concern. This risk appears most pronounced in luxury price points that already had above-average for-sale inventory relative to demand and therefore have limited pricing power. Outside of these limited situations, we consider the overall change to personal taxes as a positive catalyst for housing demand.
Friday, January 12, 2018 by Zelman & Associates
Filed under: Macro Housing
Looking for More Insightful Content?
Explore our ResearchAffordabilityApartmentsBaby BoomersBuild-For-RentBuilding ProductsConstruction LendingConsumerDemographicsEntry-LevelExisting Home SalesHome ImprovementHome PricingHomebuildingHomeownershipHousehold FormationHousingHousing StartsInstitutional InvestorsInterest RatesM&AMacro HousingManufactured HousingMillennialsMortgageMortgage RatesNew Home SalesReal Estate ServicesRefinanceSG&ASingle-Family RentalStocksStudent DebtSupplySurvey