Apartment Executives’ Sentiment Index Indicates Further Softness in Trends
Friday, February 23, 2018 by Zelman & Associates
Filed under: ApartmentsSurvey
Once a month, we survey private multi-family operators, developers, brokers and lenders to gauge fundamental trends across the sector. Our survey covers roughly 1.5 million institutional-quality units and developers that accounted for 9% of 2017 multi-family starts, providing us extraordinary insights to assess current dynamics and the likely path forward.
In January, rental revenue increased 3.0% year over year for our survey contacts, which summarizes activity over the last year in a smoothed fashion. For leases signed only in the seasonally-slower January, revenue growth increased just 1.9%, which was softer than 2.4% last January and 2.9% in January 2016 and indicates that operators continue to struggle with an abundance of new supply.
Not surprisingly, depressed pricing power was most notable in urban locations. When asked to rate performance versus expectations across assets by price point and geography on a 0-100 scale, our contacts were most satisfied with their class-B suburban product, which scored 55.4. Class-A assets in the suburbs (50.0) and urban environments (48.5) were underwhelming while urban class-B (43.5) was weakest, perhaps a sign that class-B projects are being more impacted than anticipated by new construction that is at higher rental rates but where incentives are trickling downstream. Both class-A and class-B urban scores have been below the key 50-point threshold each of the last five months.
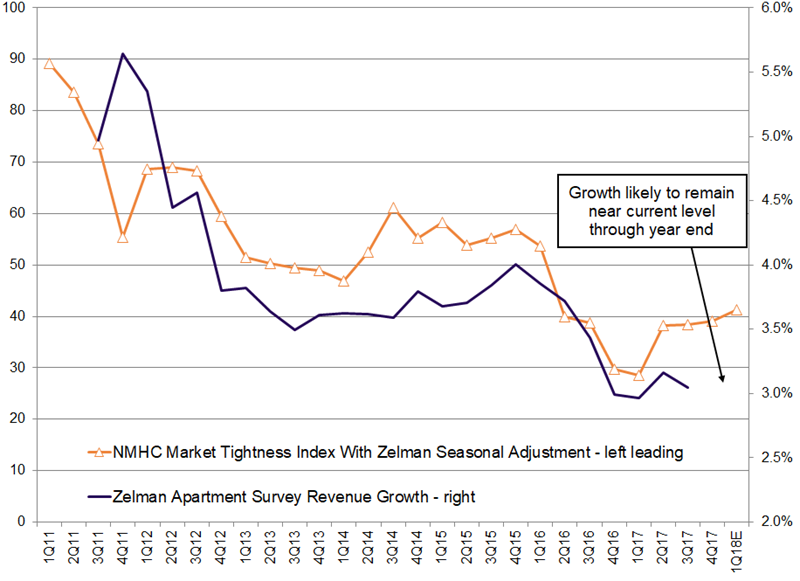
While we believe that this dynamic is likely to hold through 2018 and into 2019 given a robust pipeline of units under construction, we also analyzed feedback from the National Multifamily Housing Council (NMHC) quarterly survey of apartment market conditions. A few weeks ago, the latest reading of 36 was down one point from the prior quarter; however, the responses are not adjusted for typical seasonality. Based on our analysis, we estimate that a seasonally-adjusted index would have improved to 41 from 39. Although this still implies relative weakness in the market, it is less negative than the trough of 29 at this time a year ago.
Importantly, we show that there is a strong 85% correlation between the NMHC index and revenue growth as reported in our survey, with the NMHC leading growth by four quarters. In other words, the modest tick-up in the NMHC index over the last year is encouraging, but it is going to take time before market fundamentals rebound. Instead, we believe current rental pricing power will be stable to modestly softer through the end of the year, with divergence still evident between urban and suburban locations.
The relatively cautious outlook was also shared by our survey participants, with executives forecasting 3.0% growth over the next year. Although this is consistent with current growth, actual results have been below forecasts since we began asking the question four years ago and the latest reading ranks as the weakest over this period.
Friday, February 23, 2018 by Zelman & Associates
Filed under: ApartmentsSurvey
Looking for More Insightful Content?
Explore our ResearchAffordabilityApartmentsBaby BoomersBuild-For-RentBuilding ProductsConstruction LendingConsumerDemographicsEntry-LevelExisting Home SalesHome ImprovementHome PricingHomebuildingHomeownershipHousehold FormationHousingHousing StartsInstitutional InvestorsInterest RatesM&AMacro HousingManufactured HousingMillennialsMortgageMortgage RatesNew Home SalesReal Estate ServicesRefinanceSG&ASingle-Family RentalStocksStudent DebtSupplySurvey