Affordability Reportedly at 10-Year Low – Is it Fear Mongering?
Friday, August 24, 2018 by Zelman & Associates
Filed under: AffordabilityHome Pricing
Two weeks ago, the National Association of Home Builders (NAHB) published its Housing Opportunity Index, which is intended to frame housing affordability across the country. The index is calculated on a 0-100 scale, with higher values aligned with stronger affordability. For 2Q18, the index registered 57.1, weakening from 61.6 in 1Q18 with home price appreciation and higher interest rates offsetting income growth. This is the lowest level since 3Q08, leading to the NAHB’s headline that affordability has reached a 10-year low, which cascaded throughout the news media in a negative way.
The conclusion is factually correct. The cost of homeownership, which in the case of the NAHB index attempts to include mortgage principal, interest, property taxes and property insurance, is higher at present than any point over the last ten years. But what does that really mean? Does that mean that housing is unaffordable? Can we expect single-family real estate to be dirt cheap when unemployment is near the lowest level of the last 40 years? Or when the stock market is close to all-time highs? Or when single-family starts are barely above last cycle’s trough?
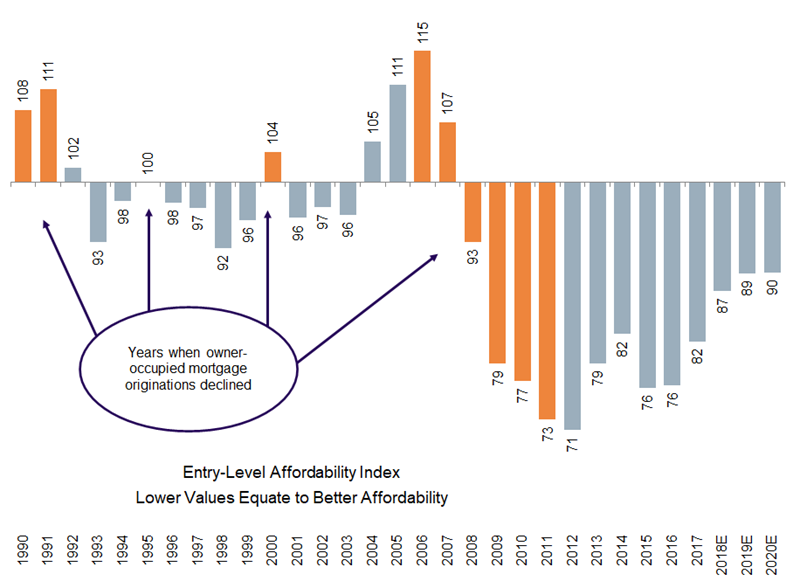
In our opinion, affordability is a question for the entry-level segment of the market as existing homeowners benefit from home price appreciation and can use that equity to upgrade or improve their balance sheet position. This is why our primary affordability index incorporates factors that closely align with marginal entry-level homebuyers, including median home values, FHA mortgage financing and income growth representative of a non-supervisory or production employee.
For our summary index, a reading of 100 is consistent with historical norms. Thus, when our index is above 100, it is less favorable for entry-level homebuyers as was the case in 2005 (111), 2006 (115) and 2007 (107). Dating back to 1990, the most favorable years for our index were 2012 (71) and 2011 (73). Given healthy home price appreciation and gradual increases in mortgage rates, our index is expected to average 87 for 2018 – also the highest level in ten years. But, it remains the fact that the monthly cost of ownership when compared against income is still more favorable than historic norms, even though the housing recovery is in its seventh year.
If we assume modest acceleration in income growth, modest deceleration in home price appreciation given gradually rising inventory and slight increases in mortgage rates consistent with that implied by the bond market, our index would climb further to 89 in 2019 and 90 in 2020.
Our index remaining below the key 100 threshold is very important. Consider that since 1990, there have been four periods when owner-occupied purchase mortgage originations have declined: 1990-91, 1995, 2000 and 2006-11. All four of these contractions either overlapped or immediately followed our index registering 100 or higher. That does not appear to be a near-term risk based on the health of our affordability index at present.
Friday, August 24, 2018 by Zelman & Associates
Filed under: AffordabilityHome Pricing
Looking for More Insightful Content?
Explore our ResearchAffordabilityApartmentsBaby BoomersBuild-For-RentBuilding ProductsConstruction LendingConsumerDemographicsEntry-LevelExisting Home SalesHome ImprovementHome PricingHomebuildingHomeownershipHousehold FormationHousingHousing StartsInstitutional InvestorsInterest RatesM&AMacro HousingManufactured HousingMillennialsMortgageMortgage RatesNew Home SalesReal Estate ServicesRefinanceSG&ASingle-Family RentalStocksStudent DebtSupplySurvey