A Look at the Pitfalls of the Most-Cited Household Formation Time Series
Friday, September 7, 2018 by Zelman & Associates
Filed under: Household Formation
Once a quarter, the Census Bureau publishes the results of its Housing Vacancy Survey (HVS), which includes estimates for occupied housing units, also referred to as households, vacancies and the homeownership rate. Given its frequency, the data set is most frequently cited by the media, industry executives and analysts. However, the pitfalls are rarely discussed.
For 2Q18, the Census Bureau reported that there were 121.2 million households, a 1.67 million increase from 2Q17, including a 1.77 million gain for owner-occupied units and a 0.10 million decline in rental units. The reported gain in total households was the strongest since 2Q15 while the increase in owned households was the greatest since 1Q05.
Speaking to the dependence on such data, on its 2Q18 conference call to discuss financial results, management for Realogy Holdings, whose brokerage brands amass the largest share of existing home transactions in the industry, cited the HVS statistics directly, noting “there were 1.8 million new homeowners added over the last 12 months according to the latest Census Bureau report, and millennials are the most important factor driving the increase.”
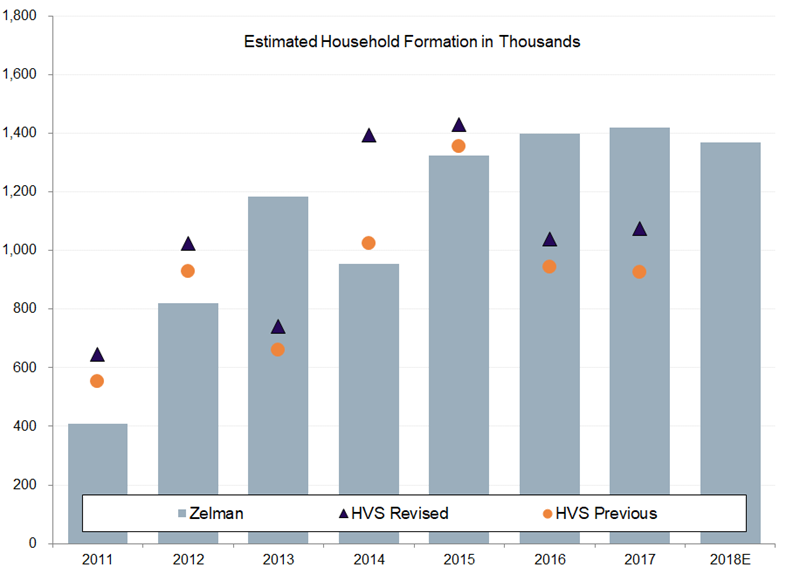
However, along with the 2Q18 release, prior quarters were revised to reflect an updated weighting methodology, which affected prior 2011-17 estimates. The HVS estimates for new households were revised higher in each year, ranging from 6% in 2015 to 36% in 2014. Collectively for the seven-year period, the HVS now estimates that there were 7.35 million new households formed, a 15% increase from 6.40 million previously. While this now better matches our estimate of 7.52 million for those years, it also means that industry observers utilizing the government data underappreciated household formation by a material amount.
The other curious aspect of the HVS data that is seemingly overlooked by those citing the statistics is that the reported strength this quarter occurred in the face of fundamental softness in home sales. Existing home closings were down 2% year over year in 2Q18, the worst performance since 3Q14 while new home construction completions were up only 6% year over year, on the lower end of the 5-9% range over the prior three quarters. Is it even mathematically possible that household formation was the best in three years with this backdrop?
To form our household formation estimates, we uniquely incorporate data on residential electric customer counts and triangulate the conclusions with new construction statistics and vacancy rates to ensure that there is alignment across the various metrics. This has led to significantly less volatile estimates than those provided by the government. For 2018, we estimate 1.37 million new households will be formed, down from 1.42 million in 2017 and 1.40 million in 2016. Positively, while recent household gains have reached our demographically-driven estimate for normalized demand, a still-elevated share of young adults living at home implies that pent-up demand can either drive reacceleration in household formation, or sustain above-average expansion for longer.
Friday, September 7, 2018 by Zelman & Associates
Filed under: Household Formation
Looking for More Insightful Content?
Explore our ResearchAffordabilityApartmentsBaby BoomersBuild-For-RentBuilding ProductsConstruction LendingConsumerDemographicsEntry-LevelExisting Home SalesHome ImprovementHome PricingHomebuildingHomeownershipHousehold FormationHousingHousing StartsInstitutional InvestorsInterest RatesM&AMacro HousingManufactured HousingMillennialsMortgageMortgage RatesNew Home SalesReal Estate ServicesRefinanceSG&ASingle-Family RentalStocksStudent DebtSupplySurvey