A More Detailed Look at Sizeable Drop in Recent Births
Friday, October 19, 2018 by Zelman & Associates
Filed under: Demographics
In June of this year, we analyzed preliminary 2017 birth data that revealed a surprising 2.3% drop from 2016, including a 1.3% decline for women at least 25 years old, which reversed similar growth in the prior year. With more detailed data now available across states, including by age of the mother, race and marital status, we extend our analysis further in search of any notable driver of the substantial year-to-year shift in trends.
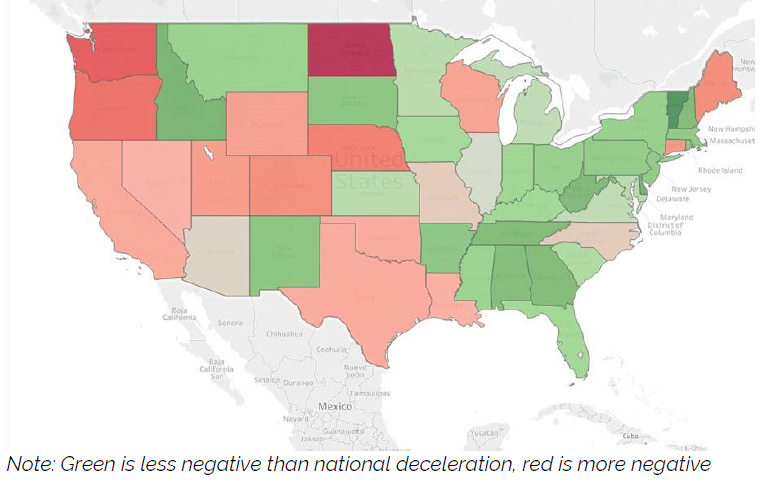
Starting geographically, for each state and the District of Columbia, we isolate births to women at least 25 years old given the notion that declines in younger cohorts is likely a longer-term benefit to the economy. We compare the change in births from 2016-17 to that from 2015-16. In other words, we are focused on whether the growth rate accelerated or decelerated more than average. Versus the 240 basis point deceleration for the entire country, only Vermont (170 basis points) and Delaware (20 basis points) accelerated.
The greatest deceleration in growth rates for 25-plus year olds was in North Dakota (760 basis points), Alaska (650), Washington (590), Oregon (520) and Nebraska (480). In addition to North Dakota and Alaska, other states with heavy exposure to oil & gas exploration such as Texas, Oklahoma, Louisiana and Colorado were also weaker than average. Perhaps the economic weakness in that sector in late 2015 and 2016 impacted family formation in late 2016 and early 2017.
The expanded data set also includes more demographic detail. In 2017, approximately 60% of births were by a married woman. Looking only at women that were at least 25 years old, 71% were married, including 89% for Asians, 80% for Whites, 58% for Hispanics and 41% for Blacks.
Like we did for the states, if we compare 2016 and 2017 birth growth rates by race and marital status, we find other outliers. On one hand, births to married Blacks accelerated 60 basis points while unwed Blacks decelerated just 30 basis points. This was balanced by larger-than-average declines for Asians, both married (730 basis points) and unmarried (410 basis points).
For Whites and Hispanics, the deceleration largely matched the overall country, although unmarried declines were less significant than for married peers in both cases, including unmarried White (down 140 basis points), unmarried Hispanics (down 210 basis points), married Hispanics (down 220 basis points) and married Whites (down 250 basis points).
Regardless of how we split the 2017 data, it is difficult to isolate the deceleration to any one factor. With 2017 growth weaker than in 2016 across marital status and nearly all states and races, the message would not change dramatically even if we discarded the negative extremes. Either way, 2017 would have underperformed the prior trend. Nevertheless, we remain optimistic that a stronger economic environment and continued strength in household formations in late 2017 and early 2018 should result in a better birth story for this year.
Friday, October 19, 2018 by Zelman & Associates
Filed under: Demographics
Looking for More Insightful Content?
Explore our ResearchAffordabilityApartmentsBaby BoomersBuild-For-RentBuilding ProductsConstruction LendingConsumerDemographicsEntry-LevelExisting Home SalesHome ImprovementHome PricingHomebuildingHomeownershipHousehold FormationHousingHousing StartsInstitutional InvestorsInterest RatesM&AMacro HousingManufactured HousingMillennialsMortgageMortgage RatesNew Home SalesReal Estate ServicesRefinanceSG&ASingle-Family RentalStocksStudent DebtSupplySurvey