Halfway Through 2018, Births Reverse Surprising Decline of 2017
Friday, November 30, 2018 by Zelman & Associates
Filed under: DemographicsMillennials
In 2007, there were an estimated 4.32 million births, according to data from the Center for Disease Control, ranking as the largest annual total in the history of the country. Since that time, births have declined each year through 2017 aside from 2014, aggregating to a 10.7% drop over the decade. The 2017 decline of 2.3% was staggering, ranking third worst over the last 30 years behind only the Great Recession impacted years of 2009 and 2010.
Thankfully, with the release of 2Q18 data, it appears our optimism for a 2018 rebound in core age cohorts appears justified thus far. Through 1H18, we estimate that total births were down 1.2% year over year, improving from the 2017 drop, albeit still more negative than the 0.8% decline in 2016.
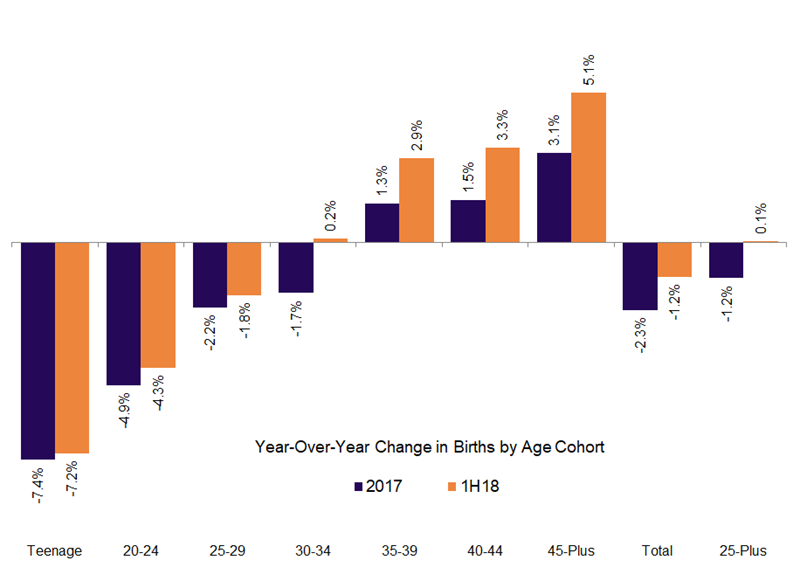
Teenage births continued their remarkable descent, falling 7.2% year over year in 1H18 versus 7.4% in 2017 and an average decline over the prior ten years of 8.0%. For perspective, births to teenagers represented just 5% of the total in 1H18 versus 13% in 1990 and 16% in 1980.
For 20-24 year old women, births declined 4.3% in the first half of the year versus 4.9% in 2017, setting the age cohort up for the 11th consecutive annual decrease after growing each year from 1998 through 2007.
Births to women at least 25 years of age, which we have deemed “good births” in the past, increased slightly (0.1%) in 1H18, notable improvement from a 1.2% decline in 2017 but still softer than 1.2% growth in 2016. The growth rate improved across all five-year age cohorts, with 35-39, 40-44 and 45-49 year old women posting a year-over-year increase of at least 2.9% thus far in 2018.
Based on the first half of the year, we believe the substantial pullback in births in 2017 will indeed prove to be a blip amidst an otherwise healthy story overlapping the recent economic expansion. Although, the relative strength of 25-plus year old births witnessed from 2011-16 still appears out of reach.
Friday, November 30, 2018 by Zelman & Associates
Filed under: DemographicsMillennials
Looking for More Insightful Content?
Explore our ResearchAffordabilityApartmentsBaby BoomersBuild-For-RentBuilding ProductsConstruction LendingConsumerDemographicsEntry-LevelExisting Home SalesHome ImprovementHome PricingHomebuildingHomeownershipHousehold FormationHousingHousing StartsInstitutional InvestorsInterest RatesM&AMacro HousingManufactured HousingMillennialsMortgageMortgage RatesNew Home SalesReal Estate ServicesRefinanceSG&ASingle-Family RentalStocksStudent DebtSupplySurvey