Some Fascinating Conclusions as Home Affordability Concerns Come into Focus
Friday, November 16, 2018 by Zelman & Associates
Filed under: AffordabilityMortgage
Over the last year, home price appreciation has averaged roughly 5.5% across the country while the typical 30-year fixed mortgage rate has expanded by almost exactly 100 basis points. A simple calculation results in the average monthly mortgage payment climbing a substantial 19% due to these two factors. While this ignores potential offsets, it is understandably calling into question affordability concerns, with a particular focus on rising mortgage debt-to-income (DTI) ratios. However, we will show that a singular focus on DTIs overlooks many important dynamics.
As a quick definition, back-end DTI ratios are an important mortgage underwriting standard, encompassing the monthly cost burden of principal, interest, mortgage insurance, property insurance and taxes, and debt related to auto loans, credit cards or student debt. In 2017, the average DTI for all purchase mortgage borrowers was 37.4%, rising for the fourth consecutive year. Based on year-to-date originations, we estimate that the average DTI is set to rise further in 2018 to 38.5%.
While this is the most elevated ratio of the housing recovery thus far, that is to be fully expected with mortgage rates at the highest level since 2011 and home price appreciation outstripping income growth each of the last seven years. But that does not get at the heart of the question: we know that housing is relatively less affordable but is it also absolutely unaffordable?
As the affordability debate is surely to remain vibrant for the foreseeable future, for those focused on rising DTIs, we note several important conclusions from our analysis. First, incorporating 2018 income growth (~3%), home price appreciation (~5.5%) and average borrowing costs (up ~50 basis points), average 2018 DTI should hypothetically increase closer to 160 basis points from 2017 but the eventual increase will be roughly 110 basis points. So, consumers are mitigating almost a third of the pressure from rates in other ways, likely led by opting for a less expensive house.
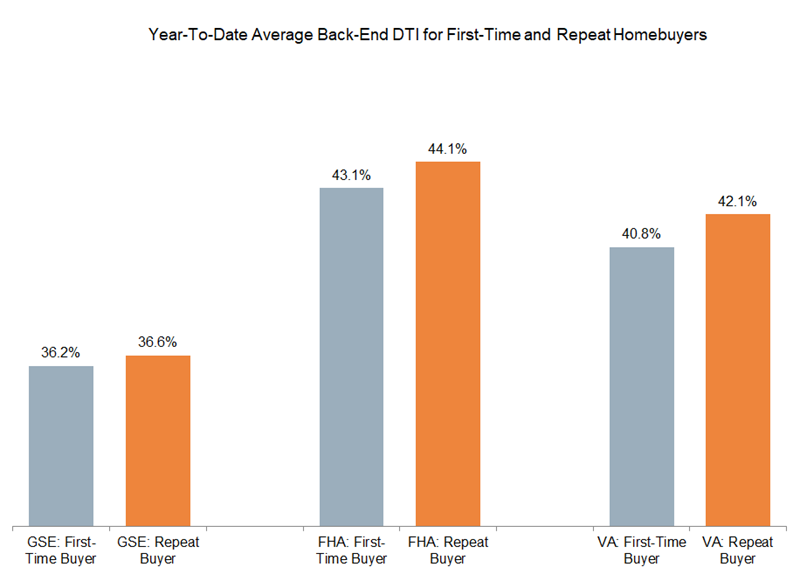
Separately, if DTI is the best measure of affordability, then it should stand to reason that entry-level homebuyers would have a higher ratio than repeat buyers. In fact, the opposite is true. To prove the point, we isolate the average back-end DTI across conventional, FHA and VA mortgages, separating first-time and repeat buyers. Our analysis covers the last six years where robust data is available across the spectrum. For every year analyzed and for each segment of the market, entry-level buyers had a lower DTI than repeat buyers.
We do not actually believe that entry-level buyers are on stronger financial footing than repeat buyers, as they also carry lower credit scores and lower downpayments, on average. Nevertheless, this analysis strongly suggests that using DTI in isolation to assess affordability constraints can be incredibly misleading.
It is also noteworthy that when comparing 2018 to 2017, the increase in DTI ratios is almost identical for entry-level buyers, climbing 110 basis points on average, versus repeat buyers up 100 basis points. We believe it is an encouraging sign that entry-level buyers, which are most susceptible to affordability constraints, are not stretching more than move-up buyers where affordability is less of an issue.
From our perspective, affordability is a cross section of many factors that require attention in a holistic manner. From this wider lens, we believe entry-level affordability is still favorable from a historical perspective, but recognize that future home price appreciation will likely be governed by the path of interest rates and the impact on monthly payments.
Friday, November 16, 2018 by Zelman & Associates
Filed under: AffordabilityMortgage
Looking for More Insightful Content?
Explore our ResearchAffordabilityApartmentsBaby BoomersBuild-For-RentBuilding ProductsConstruction LendingConsumerDemographicsEntry-LevelExisting Home SalesHome ImprovementHome PricingHomebuildingHomeownershipHousehold FormationHousingHousing StartsInstitutional InvestorsInterest RatesM&AMacro HousingManufactured HousingMillennialsMortgageMortgage RatesNew Home SalesReal Estate ServicesRefinanceSG&ASingle-Family RentalStocksStudent DebtSupplySurvey