As Consumer Debt Hits New Peak, It’s Not the Young Flashing Warning Signs
Friday, December 28, 2018 by Zelman & Associates
Filed under: Baby BoomersMacro HousingMillennials
Once a quarter, the Federal Reserve Bank of New York releases data on household debt and credit, which is often referenced to understand total leverage across the consumer, including details across the major sources: mortgages, student debt, auto loans and credit cards. As of 3Q18, households held $13.5 trillion of debt, up 4% year over year and ahead of the prior peak in 2008 for the seventh consecutive quarter. Although the headline figure raises angst, it fails to put debt into relevant historical context.
First, the data are not adjusted for inflation, which obviously results in an upward bias over time. Second, growth or the age composition of the adult population is not considered, but should have a meaningful impact on any assessment of leverage. To form a more usable time series, we adjust historical years for inflation, and we isolate major age cohorts on a per capita basis.
Extrapolating results from the first three quarters of 2018 into the fourth quarter, we estimate that total consumer debt will average $13.4 trillion for the entire year, up 4% year over year. Across the 253 million adults in the country, this equates to $52,900 of debt per person, which ranges from $17,200 for 18-29 year olds to $83,500 for 40-49 year olds. Adjusted for inflation and population growth, 2018 debt per adult stands 1% ahead of the 2008 cycle peak, but the underlying age detail is surprising. For 18-29 year olds, today’s debt balance is 20% below 2008, and for 30-39 year olds, it stands 7% lower. In fact, almost the entire increase in inflation-adjusted debt per person was driven by a 46% jump for 70-plus year olds.
As of 3Q18, mortgage debt was by far the greatest piece of the consumers’ debt load at 68% on average. As homeownership rates are lower across the board from 2008-18, with the exception of 70-plus year olds, a more favorable total leverage comparison should be expected, to some degree. However, we find that mortgage debt alone does not explain the decline among younger adults. For instance, among 20-39 year olds, homeownership rates are down roughly 15-20 percentage points since 2008. Taking this into account, consumer debt for 18-29 year olds would still be approximately 10-15% lower than in 2008 and for 30-39 year olds it would be up 4%, still less than for all other cohorts except people in their 60s (up 3%).
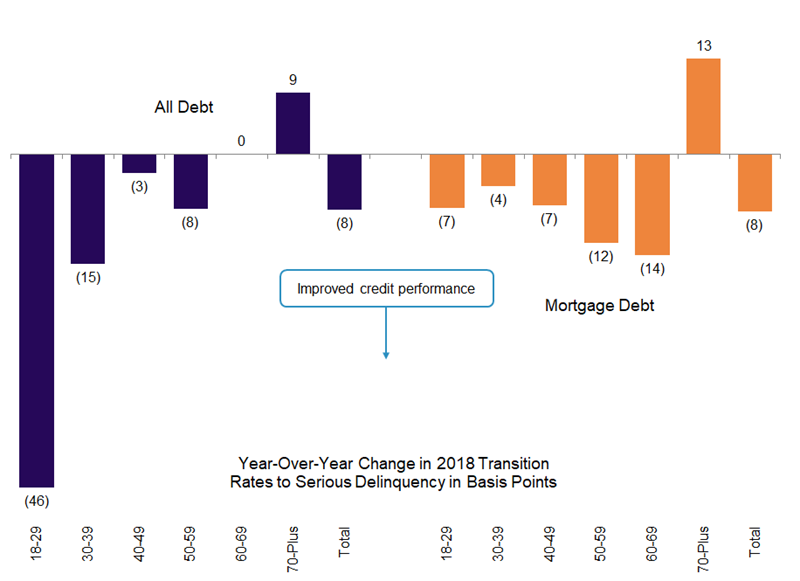
This was not the only surprising conclusion to come from the age-specific detail of the latest quarterly report. In 3Q18, 2.37% of consumers transitioned into serious delinquency on their credit report, down six basis points from 3Q17. On a year-to-date basis, the improvement has been eight basis points. For the quarter and the year-to-date period, transition rates have improved the most for 18-29 year olds and 30-39 year olds and have actually deteriorated for 60-69 year olds and 70-plus year olds. Nearly the same story can be told when isolating mortgage performance.
In our opinion, while total consumer leverage is probably most relevant when assessing macroeconomic implications, given the skew of home purchases to young adults, these age-related nuances carry heavy weight for the housing market. Might entry-level consumers’ balance sheets be in better shape than assumed?
Friday, December 28, 2018 by Zelman & Associates
Filed under: Baby BoomersMacro HousingMillennials
Looking for More Insightful Content?
Explore our ResearchAffordabilityApartmentsBaby BoomersBuild-For-RentBuilding ProductsConstruction LendingConsumerDemographicsEntry-LevelExisting Home SalesHome ImprovementHome PricingHomebuildingHomeownershipHousehold FormationHousingHousing StartsInstitutional InvestorsInterest RatesM&AMacro HousingManufactured HousingMillennialsMortgageMortgage RatesNew Home SalesReal Estate ServicesRefinanceSG&ASingle-Family RentalStocksStudent DebtSupplySurvey