Latest Population Estimates Offer First Look at Impact of Tax Reform
Friday, December 28, 2018 by Zelman & Associates
Filed under: DemographicsMacro Housing
Following the passage of income tax reform a year ago, we detailed the relative winners and losers and the expected impact on housing demand. At that time, it was estimated that the largest shares of taxpayers set to experience an increase in income taxes resided in New York, Maryland, New Jersey, California and Connecticut. For perspective, on average, 11% of taxpayers in these states were estimated to face a higher tax bill under tax reform versus 7% nationally.
For many, the assumption was that the relative headwind of tax reform in high-tax states would put additional pressure on migration trends that have been unfavorable for some time. With the Census Bureau just releasing state-level population estimates for the year ended July, we get our first glimpse into whether this fear is turning into reality.
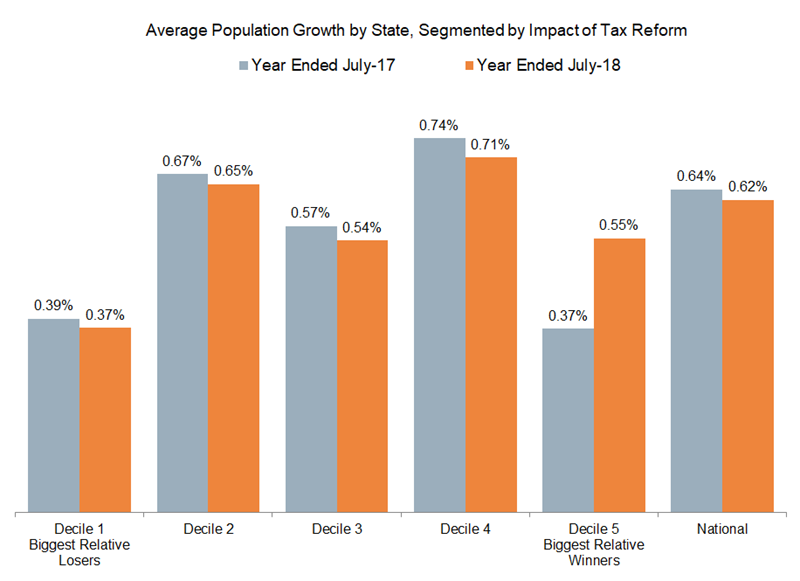
Nationally, population growth was estimated at 0.62% for the latest year, decelerating from 0.64% in the prior year. According to our data, this is the weakest annual expansion since 1945, and brings the decade-to-date annual increase to 0.70% versus 0.93% last decade, 1.24% in the 1990s and 0.94% in the 1980s.
For the latest year, the strongest increases at the state level were in Nevada (2.1%), Idaho (2.1%), Utah (1.9%), Arizona (1.7%) and Florida (1.5%). On the other hand, contraction was reported in West Virginia (0.6%), Illinois (0.4%), Alaska (0.3%) and Hawaii (0.3%).
To best assess the potential impact of tax reform, we segmented the 50 states into deciles based on the projected relative benefit or headwind on income taxes and compared the trend in population growth between this year and last year. For instance, the ten states with the lowest benefit from tax reform saw population growth of just 0.37% over the last year, the weakest of the deciles. However, that does not capture the entire picture because the same was true last year at 0.39%, before tax reform was passed. Relative to the national change in population, the variance was static. Notably, in New York, New Jersey and Connecticut, relative population growth actually improved modestly year to year.
The ten most favorably-positioned states from an incremental tax standpoint posted population growth of 0.55% in the most recent period, improving from 0.37% a year ago, led by strong acceleration in Wyoming, North Dakota and Nevada. Said differently, growth in these ten states trailed the national average by only seven basis points this year versus 27 basis points last year.
Overall, it is likely too early to assess the true ramifications of tax reform on state-to-state migration trends, but at this point there is no clear trend, and we believe any overhang on the housing market experienced in 2018 in high-tax states was likely more related to confidence than actual out-migration.
Friday, December 28, 2018 by Zelman & Associates
Filed under: DemographicsMacro Housing
Looking for More Insightful Content?
Explore our ResearchAffordabilityApartmentsBaby BoomersBuild-For-RentBuilding ProductsConstruction LendingConsumerDemographicsEntry-LevelExisting Home SalesHome ImprovementHome PricingHomebuildingHomeownershipHousehold FormationHousingHousing StartsInstitutional InvestorsInterest RatesM&AMacro HousingManufactured HousingMillennialsMortgageMortgage RatesNew Home SalesReal Estate ServicesRefinanceSG&ASingle-Family RentalStocksStudent DebtSupplySurvey