Why are So Many People Just Staying Put?
Friday, December 14, 2018 by Zelman & Associates
Filed under: DemographicsMacro Housing
According to our analysis of recently-released Census Bureau data, approximately 10% of current householders moved over the year ended 1Q18, down from 11% in the year-ago period and continuing a multi-decade decline. For perspective, this share averaged 13% from 2000-09 and 16% during the 1990s. Put another way, the probability of a household moving has compressed by more than 40% over the last 30 years. Why has this dramatic demographic shift taken place?
Over the last two decades, the Current Population Survey Annual Social and Economic Supplement has asked survey participants about their motivations to move. We utilize this data to help answer why the move rate has been under such persistent secular pressure.
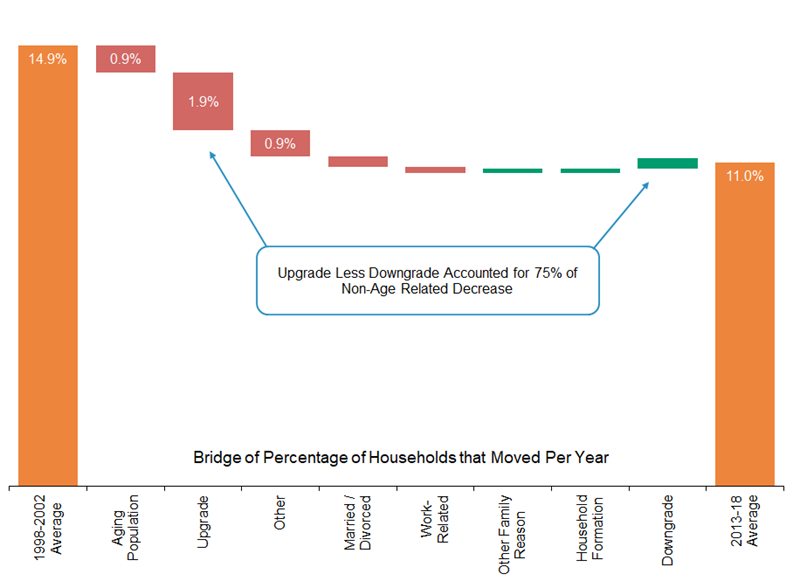
To start, the aging of the population has been a critical factor over time. Consider that last year roughly 20% of the adult population was at least 65 years old, which compares to 17% in 1990. This mix shift is material as adults younger than 65 are over three times more likely to move than their older counterparts. More specifically, the move rate averaged 11.0% from 2013-18 versus 14.9% from 1998-2002. We calculate that the mix of age cohorts is responsible for 23% of the decline. The remaining 77% of the decrease is behavioral.
Interestingly, after controlling for the age effect, the percentage of respondents that moved to form their own household was slightly higher from 2013-18 than from 1998-2002. Several other factors were modest headwinds, including reasons related to marriage/divorce and employment. However, the most dramatic shift over time has been by those seeking a discretionary upgrade.
In the most recent survey, only 2.5% of households moved to attain homeownership or improve their home or neighborhood. The last eight years have been stuck in a 2.5-2.7% range, which is significantly lower than the 4.8% average from 1998-2002. This means that the impact of households staying put instead of seeking a discretionary upgrade is responsible for 75% of the age-adjusted decrease in the move rate.
There are many theories about the decline, including hangover effects from the Great Recession, the ease of telecommuting, homes increasing in size over time, a lack of alternative inventory and low in-place mortgage rates, but it is difficult to isolate any singular factor. If sustained, the byproducts of a reduced move rate could be numerous, such as a greater emphasis on home improvements, fewer existing home sales, a greater need for entry-level new construction, reduced turnover for multi-family and single-family landlords and a reduction in cross-state migration.
Friday, December 14, 2018 by Zelman & Associates
Filed under: DemographicsMacro Housing
Looking for More Insightful Content?
Explore our ResearchAffordabilityApartmentsBaby BoomersBuild-For-RentBuilding ProductsConstruction LendingConsumerDemographicsEntry-LevelExisting Home SalesHome ImprovementHome PricingHomebuildingHomeownershipHousehold FormationHousingHousing StartsInstitutional InvestorsInterest RatesM&AMacro HousingManufactured HousingMillennialsMortgageMortgage RatesNew Home SalesReal Estate ServicesRefinanceSG&ASingle-Family RentalStocksStudent DebtSupplySurvey