Key Factors Behind Packing Up and Moving Across the Country
Friday, January 11, 2019 by Zelman & Associates
Filed under: DemographicsMacro Housing
Last week, United Van Lines, the largest moving company in the country, released its annual National Movers Survey, which provides insight into state-to-state moves. Although professional long-distance moves likely skew toward single-family and higher-income households, with over 100,000 trips captured in the data, we find the relative comparisons across states and over time to be informative.
There are 40 states with at least 1,000 moves covered by the survey in 2018. The strongest in-migration share was in Oregon (64%), Idaho (62%), Nevada (62%), Arizona (60%) and South Carolina (60%). Arizona’s jump into the top five came from 9th place last year, with strong sequential improvement also reported in Indiana, Mississippi, Utah and Maine.
On the other hand, out-migration was most significant in New Jersey (67%), Illinois (66%), Connecticut (62%), New York (62%) and Kansas (59%). These same five states also had the worst migration backdrop in 2016 and 2017, and the only variance in 2015 was Ohio ranking fifth instead of Kansas. While out-migration could accelerate in some of these high-tax states, that is not yet evident in the data.
Beyond the broad trends, it is also interesting to analyze the motivations for these moves, which are summarized in the survey. For instance, 47% of state-to-state moves were driven by employment circumstances followed by 20% for family reasons, 16% related to retirement, 11% for lifestyle choices and 5% for personal health.
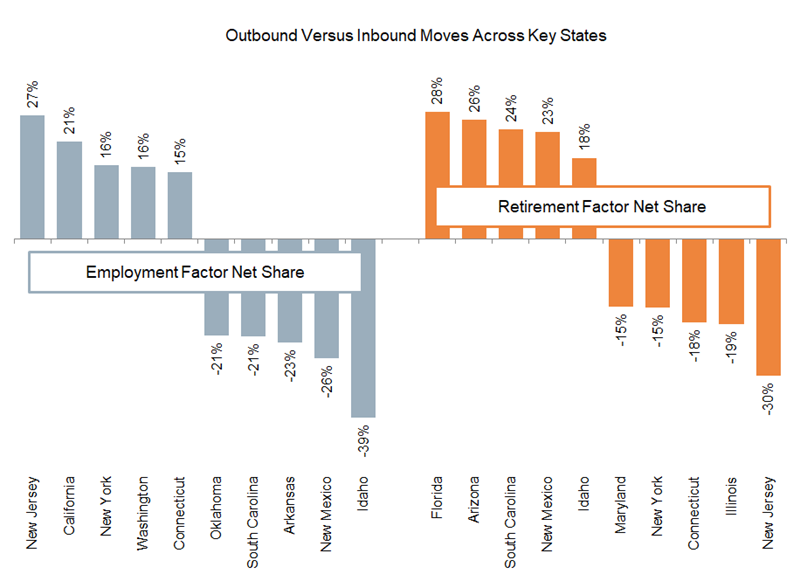
Given the heavy skew to employment, we compare the share of inbound and outbound moves citing it as a factor, resulting in a net ratio. For example, in New Jersey, 62% of those moving into the state noted employment as a driver versus 35% for those moving out, for a net 27%, representing the highest for any state. California (21%), New York (16%), Washington (16%) and Connecticut (15%) were the next most positive skews. Interestingly, aside from Washington, these states are among the most onerous from a tax standpoint. Thus, while overall migration trends are negative, the draw of strong income potential appears to be the primary factor for households moving into these states.
When looking at the retirement motivation in a similar manner, the net ratio was greatest in Florida (28%), followed by Arizona (26%), South Carolina (24%), New Mexico (23%) and Idaho (18%), which came at the expense of New Jersey (-30%), Illinois (-19%), Connecticut (-18%), New York (-15%) and Maryland (-15%). Not surprisingly, the four states with the worst overall migration trends align directly with those facing the greatest out-migration due to retirement.
Lastly, the significance of older age cohorts on state-to-state migration trends becomes more evident when isolating age specifics. According to the survey data, 55-64 year old households accounted for 23% of moves in 2018, 1.4 times higher than their share of the adult population. This was followed by 1.2 times for 65-plus year olds while 18-34 year olds accounted for 0.6 times their population share, which we attribute to a lower need for professional moving services and a non-factor from retirement.
Friday, January 11, 2019 by Zelman & Associates
Filed under: DemographicsMacro Housing
Looking for More Insightful Content?
Explore our ResearchAffordabilityApartmentsBaby BoomersBuild-For-RentBuilding ProductsConstruction LendingConsumerDemographicsEntry-LevelExisting Home SalesHome ImprovementHome PricingHomebuildingHomeownershipHousehold FormationHousingHousing StartsInstitutional InvestorsInterest RatesM&AMacro HousingManufactured HousingMillennialsMortgageMortgage RatesNew Home SalesReal Estate ServicesRefinanceSG&ASingle-Family RentalStocksStudent DebtSupplySurvey