Why an Often-Cited Existing Home Price Measure is Probably Wrong
Friday, January 11, 2019 by Zelman & Associates
Filed under: AffordabilityHome Pricing
In its most recent monthly release for November 2018, the National Association of Realtors (NAR) reported that the median price for existing home closings was $257,700, bringing the year-to-date figure to $257,500. With approximately 40% of total home closings attributable to first-time homebuyers, we focus on the median price of a market as an upper limit of the entry-level price point, making it an important measure of home affordability.
However, while the NAR figure is widely-cited and used in many assessments of the national housing market, we believe it is inflated and likely understates affordability versus other data sets. For comparison, through October 2018, CoreLogic reported a median price for all existing home closings of $216,800, or 16% lower than reported over the same time period by NAR. Meanwhile, the average prices disclosed by the NAR and CoreLogic only vary by roughly 1%. So the problem seems to lie in the median benchmark.
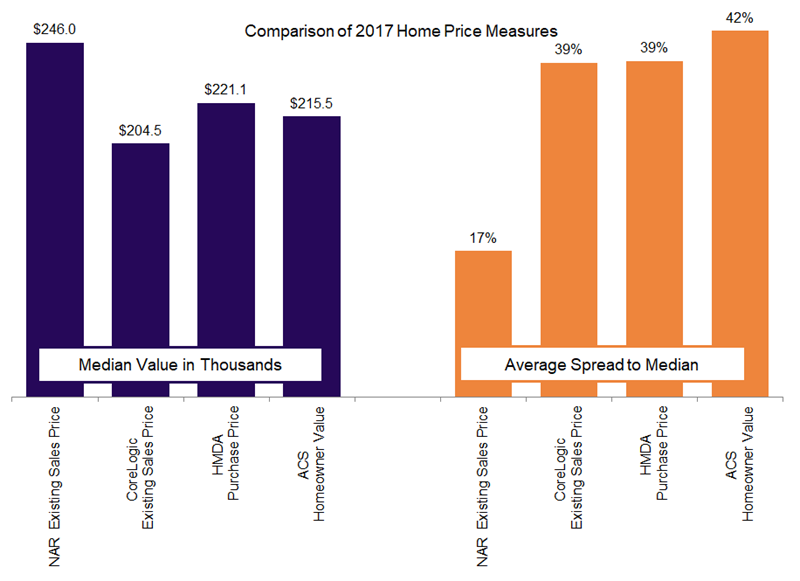
We detail 2017 median and average figures related to home purchase transactions across four data sources: (1) the NAR; (2) CoreLogic; (3) the American Community Survey (ACS) from the Census Bureau; and (4) the Home Mortgage Disclosure Act (HMDA). All four data sets offer national coverage, albeit with small nuances. The ACS figures cover all owner-occupied homes versus just those recently sold, exclude investment properties and are subject to traditional survey error. The HMDA data only cover mortgaged purchases, and thus exclude the 25-30% of homes purchased with cash, and also require an estimate for the downpayment.
Despite these nuances, the spread between the median and average calculation for the NAR is significantly less than for the other three sources. Specifically, NAR’s 2017 reported average ($287,600) was 17% higher than the median ($246,000). For CoreLogic, the average ($283,600) was 39% higher than the median ($204,500).
For the ACS, owner-occupied households estimated their home’s value at $306,900, on average, a 42% premium to the estimated median of $215,500. Lastly, for HMDA, given a skew to entry-level buyers, the median mortgage amount has a lower downpayment than for the average loan amount. Additionally, we believe that cash transactions excluded from the mortgage data typically occur at a lower average sales price, which is important to consider when comparing to the NAR and CoreLogic. Adjusting for downpayments to arrive at the purchase price, the HMDA average ($307,000) is 39% higher than the median ($221,100).
In summary, the three non-NAR sources all align with an approximate 40% gap between the average and median sales price, leaving NAR as a clear outlier. For local market analyses, the aforementioned discussion is probably irrelevant. But when you consider the heated topic of affordability today and the broad strokes used to opine on the national housing market, whether the median priced existing home costs $220,000 or $260,000 is quite material to the conclusion. Just keep that in mind with the NAR’s monthly releases.
Friday, January 11, 2019 by Zelman & Associates
Filed under: AffordabilityHome Pricing
Looking for More Insightful Content?
Explore our ResearchAffordabilityApartmentsBaby BoomersBuild-For-RentBuilding ProductsConstruction LendingConsumerDemographicsEntry-LevelExisting Home SalesHome ImprovementHome PricingHomebuildingHomeownershipHousehold FormationHousingHousing StartsInstitutional InvestorsInterest RatesM&AMacro HousingManufactured HousingMillennialsMortgageMortgage RatesNew Home SalesReal Estate ServicesRefinanceSG&ASingle-Family RentalStocksStudent DebtSupplySurvey