A New Analysis of Homebuyer Leverage Ratios and Entry-Level Implications
Friday, February 8, 2019 by Zelman & Associates
Filed under: AffordabilityEntry-LevelMortgage
In 2018, we estimate that the monthly payment for a typical entry-level homebuyer increased 11% year over year, inclusive of principal, interest and mortgage insurance. The spike was driven by an approximate 40 basis point increase in 30-year fixed mortgage rates and a 5-6% increase in home values. This marked just the fourth double-digit annual increase in our monthly payment calculation over the last 30 years, joining 2000, 2004 and 2013.
Naturally, the higher cost of homebuying put upward pressure on mortgage debt-to-income (DTI) ratios. According to our analysis of third-party data, the average back-end DTI ratio in 2018 was 38.4%, up 100 basis points from 2017 and marking the fifth consecutive annual increase. The increase in leverage ratios is actually better than would be expected for the underlying interest rate and home price environment, indicating that consumers are mitigating affordability pressures in other ways.
Nevertheless, over the last five years, back-end DTI ratios have expanded by 270 basis points, highlighting weaker relative affordability. Interestingly, over the same time period, front-end DTI ratios have increased a lesser 170 basis points. With the front-end calculation isolated to the cost of homeownership while the back-end ratio also includes other forms of leverage, principally auto loans, credit cards and student debt, a widening spread between the two could indicate that non-housing debt is a rising burden on top of escalating home prices and mortgage rates.
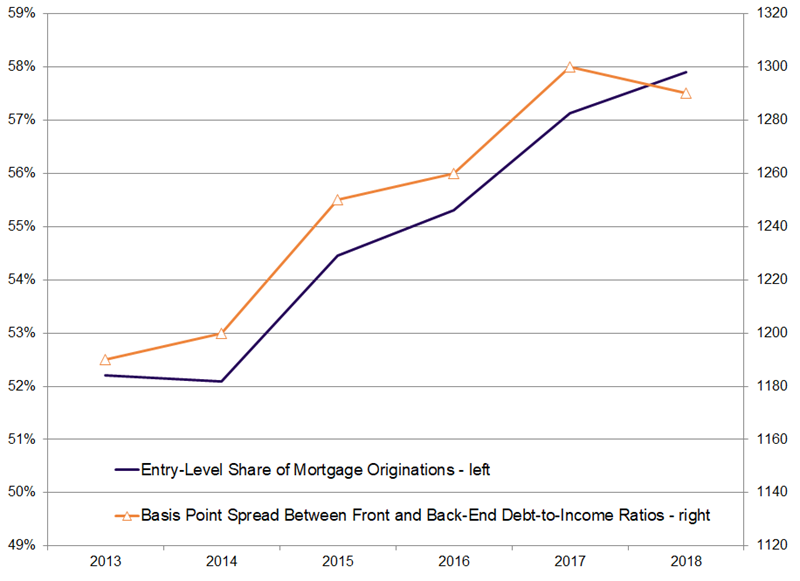
As we dug a layer deeper, we found a direct connection between the spread between front-end and back-end DTI ratios and the entry-level share of securitized mortgage originations from 2013-17, which strongly infers that entry-level buyers have a greater debt-to-income overhang of auto loans, credit cards and student loans. That should not be overly surprising given that student debt is skewed to younger adults and first-time homebuyers.
But what is surprising is that this relationship broke in 2018. Last year, the entry-level share of securitized mortgage originations set another recovery high at almost 58% but the spread between front-end and back-end debt ratios shrunk modestly. In other words, the back-end debt burden was less significant during the year even though the borrowers with the highest non-housing debt overhang increased in share.
Although it is difficult to read too far into a one-year trend, it could mean that incremental homebuyers were in a slightly better leverage position than in 2017. Or, more pessimistically, it could mean that potential homebuyers with more onerous back-end debt were priced out of the market, contributing to the overall contraction in home sales. Either way, in our opinion, the relationship bears monitoring.
Friday, February 8, 2019 by Zelman & Associates
Filed under: AffordabilityEntry-LevelMortgage
Looking for More Insightful Content?
Explore our ResearchAffordabilityApartmentsBaby BoomersBuild-For-RentBuilding ProductsConstruction LendingConsumerDemographicsEntry-LevelExisting Home SalesHome ImprovementHome PricingHomebuildingHomeownershipHousehold FormationHousingHousing StartsInstitutional InvestorsInterest RatesM&AMacro HousingManufactured HousingMillennialsMortgageMortgage RatesNew Home SalesReal Estate ServicesRefinanceSG&ASingle-Family RentalStocksStudent DebtSupplySurvey