30-Year Olds: Still Acting Young or Growing Up?
Friday, March 22, 2019 by Zelman & Associates
Filed under: DemographicsMillennials
In 2007, 66.1% of 30-39 year old households lived in a single-family dwelling, inclusive of owned and rental homes. This was the peak of the decade, with the share dropping each of the next eight years as the Great Recession unfolded and aftereffects hindered the financial situation of young adults and also delayed typical household and family formation.
After bottoming at 62.8% in 2015, the share of 30-39 year olds living in single-family households increased in 2016 and 2017, reaching 63.5%, and we believe the ratio climbed again in 2018. With so many assumptions about the younger generation often based on perception rather than reality rooted in hard facts, we dive deeper into this demographic cohort to see what we can learn from the shift to single-family living in recent years.
To best understand behavior, we split households into six segments based on their living situation. Ranked in order of significance for 30-year olds, these include:
- (1) married with children;
- (2) living alone;
- (3) single parents;
- (4) married without children;
- (5) roommates without children; and
- (6) roommates with children.
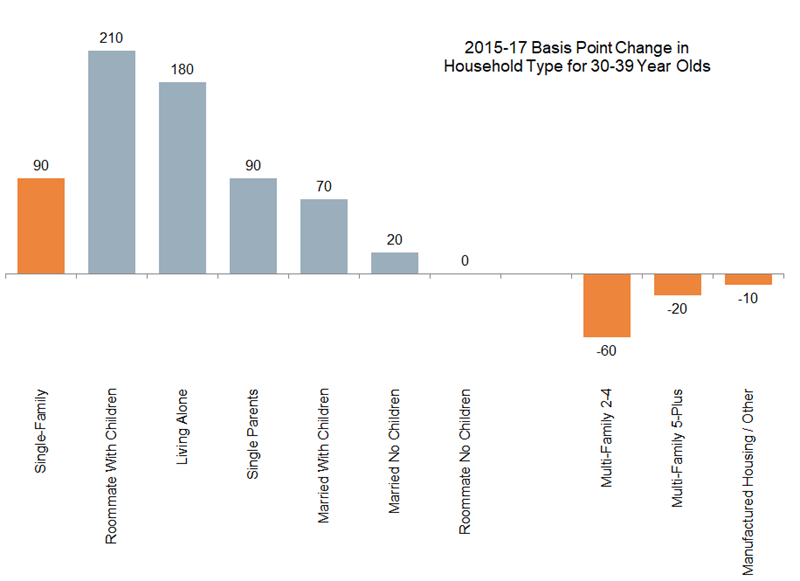
From 2015-17, the single-family share of households increased for five of the six cohorts, with roommates without children holding steady. This was mostly at the expense of multi-family housing. Married households are most prone to live in single-family housing, and there was a higher share of married households in 2017 (51.6%) than in 2015 (51.2%), aiding the skew to single-family. However, this was offset by a rising share of 30-year olds living alone or in a roommate situation without children. As such, the demographic mix was a non-factor behind the increased demand for single-family living from 2015-17 – it was simply driven by choice.
More so than demographic circumstances, we find that income growth was the driving force behind the shift. We split households into four income brackets:
- (1) under $50,000;
- (2) $50-70,000;
- (3) $70-100,000; and
- (4) over $100,000.
Although the propensity to live in single-family shelter was almost identical in 2017 to 2015 for all four income brackets, the share of 30-39 year old households earning at least $100,000 increased by 390 basis points to 29.5%. Meanwhile, the share earning less than $50,000 dropped by 360 basis points to 36.7%. This shift in income distribution can almost fully explain higher demand for single-family homes. More income translated to the ability to choose a more costly housing choice.
We previously discussed how a rising homeownership rate, even in the face of softer for-sale activity, demonstrates an increased desire to own versus rent among incremental movers, led by young adults. This analysis further highlights that the incremental type of housing being demanded by thirty year olds is swinging back to single-family as incomes are improving and life events are seemingly interfering with acting young.
Friday, March 22, 2019 by Zelman & Associates
Filed under: DemographicsMillennials
Looking for More Insightful Content?
Explore our ResearchAffordabilityApartmentsBaby BoomersBuild-For-RentBuilding ProductsConstruction LendingConsumerDemographicsEntry-LevelExisting Home SalesHome ImprovementHome PricingHomebuildingHomeownershipHousehold FormationHousingHousing StartsInstitutional InvestorsInterest RatesM&AMacro HousingManufactured HousingMillennialsMortgageMortgage RatesNew Home SalesReal Estate ServicesRefinanceSG&ASingle-Family RentalStocksStudent DebtSupplySurvey