Is Your State Winning or Losing Among Millennial, Baby Boomer Movers?
Friday, March 22, 2019 by Zelman & Associates
Filed under: Baby BoomersDemographicsMillennials
In February, we analyzed state-to-state migration patterns of 25-29 year old households – the heart of the Millennial generation – showing that the catalyst to bring a young adult to a state often differs from the reason they depart. Extending this analysis, we calculated the net exchange of 25-29 year old households for every state-to-state possibility, amounting to 2,550 data points (including the District of Columbia). For comparison, we ran the same analysis for 60-64 year olds, which are approximately at the center of the Baby Boomer generation.
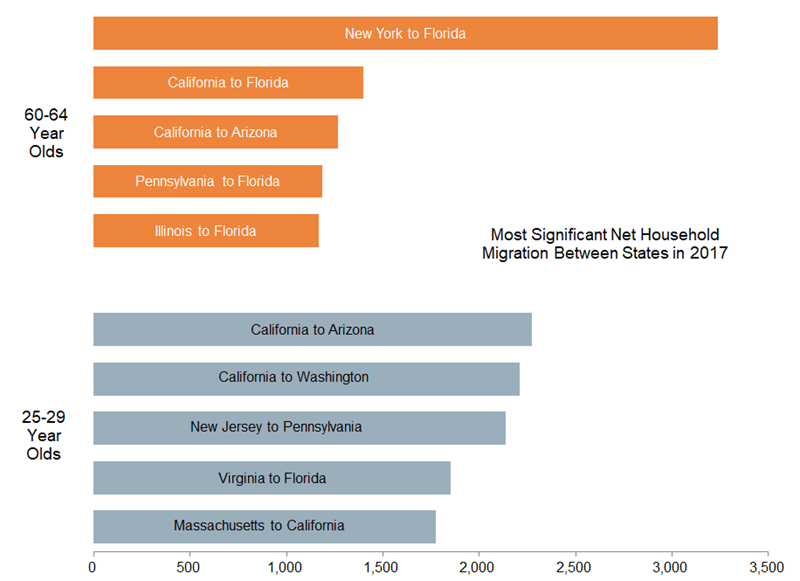
Starting with the younger sample, in 2017, almost 2,300 more households departed California for Arizona than the inverse. Said another way, Arizona came out far ahead among 25-29 year old households moving between the two states, representing the largest skew among all state-to-state possibilities. This was followed by Washington winning the exchange with California; Pennsylvania taking share from New Jersey; Florida pulling more young adults from Virginia than vice versa; and California coming out on top of the net exchange with Massachusetts.
Analyzed differently, Arizona won the young adult “recruiting” battle with 24 states and lost with only 10, the most favorable bias across the country. (Data was statistically insignificant across the remaining 16 states). Washington also screened very well, winning 30 states and only losing 13. Third through fifth place on this metric went to Colorado, Minnesota and Kentucky. Conversely, New York, North Dakota, Mississippi, Ohio and New Jersey were most likely to lose state-to-state exchanges of 25-29 year old households.
Turning our attention to 60-64 year old households, Florida overwhelmingly stood out as the net beneficiary of cross-state movements. Across the same 2,550 data points, four of the largest net migration amounts were into Florida, coming from New York, California, Pennsylvania and Illinois. Arizona winning at the expense of California was the only top five ratio not related to Florida.
Unsurprisingly, the propensity to come out ahead for 60-64 year old state-to-state movements was led by warmer, retirement-prone destinations. South Carolina was most positively skewed, winning with 18 other states where data was significant enough to analyze and losing with only 4. Florida, Tennessee, North Carolina, Nevada and Arizona followed. The most-likely-to-lose designation went to California, followed by New York, Ohio, Pennsylvania and Illinois as older adults are seemingly fleeing high cost-of-living areas and colder climates.
For the housing market, population growth is the leading driver of household demand. Beyond the aggregate figures, a proper understanding of age-related shifts as highlighted in this analysis can further help identify whether incremental supply should be targeted toward younger or older cohorts.
Friday, March 22, 2019 by Zelman & Associates
Filed under: Baby BoomersDemographicsMillennials
Looking for More Insightful Content?
Explore our ResearchAffordabilityApartmentsBaby BoomersBuild-For-RentBuilding ProductsConstruction LendingConsumerDemographicsEntry-LevelExisting Home SalesHome ImprovementHome PricingHomebuildingHomeownershipHousehold FormationHousingHousing StartsInstitutional InvestorsInterest RatesM&AMacro HousingManufactured HousingMillennialsMortgageMortgage RatesNew Home SalesReal Estate ServicesRefinanceSG&ASingle-Family RentalStocksStudent DebtSupplySurvey