Strong Signal as Homeownership Rises Again Despite Transaction Weakness
Friday, March 8, 2019 by Zelman & Associates
Filed under: Homeownership
According to the latest Housing Vacancy Survey (HVS) from the Census Bureau, the national homeownership rate improved again in 4Q18, reaching 64.8% versus 64.4% in 3Q18. This now marks the highest level since 1Q14 and represents the eighth consecutive year-over-year increase, the first time that has occurred since 1Q05.
As a refresher, in 4Q18, organic public builder orders dropped 8% year over year, the weakest since 1Q11; existing home closings were down 6%, the weakest since 1Q14; and our existing home price index ended the period up about 4.7%, the least positive since 2011. With a unanimous step backward in key housing demand metrics, it might seem contradictory that the homeownership rate improved. However, as we will show, shifts in the homeownership rate reflect the incremental decision of movers, an important metric to capture prevailing sentiment.
Based on our analysis of various demographic surveys, only about 10% of existing households move each year. That turnover is joined by new households created during the year and offset by households that dissolved, either due to death or joining an existing household, such as two independent households combining after marriage or a young adult moving back in with parents.
The propensity of these collective movers to own or rent as compared to their prior status is what determines the direction of the homeownership rate. We refer to this calculation as the incremental homeownership rate. Said differently, the only way for the homeownership rate to increase is by more renter households converting to owners than vice versa. If household movement declines due to economic uncertainty, higher interest rates or any other factor, but the share of movers still skews to buying their home, unit transactions can suffer but the homeownership rate can still increase. This was exactly the case in 4Q18.
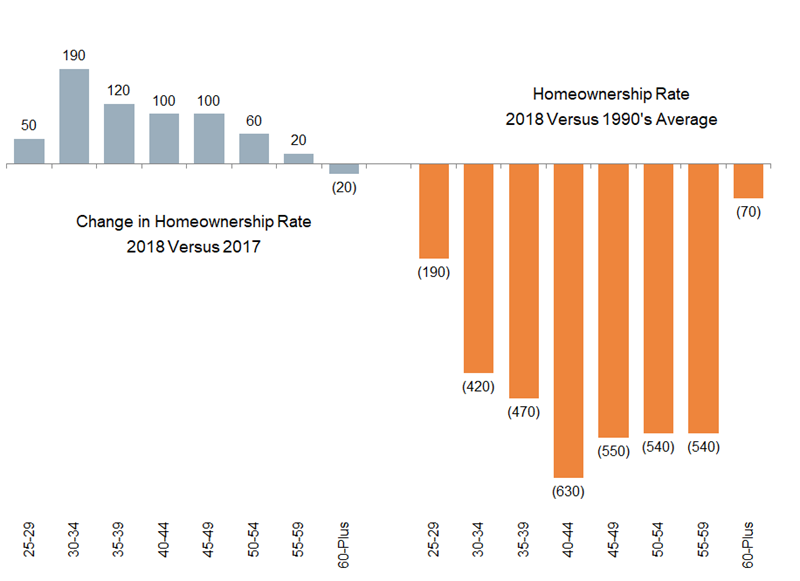
The positive direction of incremental movers toward homeownership has been most visible for younger adults. For example, relative to the 60 basis point national homeownership rate increase in 4Q18 from 4Q17, the strongest improvements were registered by 35-39 year olds (up 230 basis points), 40-44 year olds (up 220 basis points) and 30-34 year olds (up 130 basis points). It was a similar story for all of 2018, with 30-34 year olds (up 190 basis points) and 35-39 year olds (up 120 basis points) leading the national increase.
After controlling for the shifting age mix of the population over time, we note that the national homeownership rate in 2018 still stands 280 basis points lower than in the 1990s and 200 basis points lower than the prior trough from 1980-2009. It will clearly take time for the Great Recession overhang to fade and the propensity to own to climb back toward these historical benchmarks. Nevertheless, incremental data points have favored owning versus renting, consistent with our expectations, despite the frequent rhetoric to the contrary.
Friday, March 8, 2019 by Zelman & Associates
Filed under: Homeownership
Looking for More Insightful Content?
Explore our ResearchAffordabilityApartmentsBaby BoomersBuild-For-RentBuilding ProductsConstruction LendingConsumerDemographicsEntry-LevelExisting Home SalesHome ImprovementHome PricingHomebuildingHomeownershipHousehold FormationHousingHousing StartsInstitutional InvestorsInterest RatesM&AMacro HousingManufactured HousingMillennialsMortgageMortgage RatesNew Home SalesReal Estate ServicesRefinanceSG&ASingle-Family RentalStocksStudent DebtSupplySurvey