Warning Lights Flashing Red for Healthcare Costs and Housing Affordability
Friday, April 5, 2019 by Zelman & Associates
Filed under: AffordabilityMacro Housing
According to the Bureau of Economic Analysis (BEA), personal consumption expenditures totaled $13.9 trillion in 2018, up 4.7% year over year versus a 5.0% increase in disposable income, which was aided by wage growth and tax reform. The BEA segments consumer expenditures in three main categories: services (69% of total), non-durable goods (21%) and durable goods (10%).
With the national savings rate at 6.8%, skewed heavily by upper income households, the vast majority of disposable income is spent. Rather than thinking about these expenditures as services or goods, we find it more useful to think in non-discretionary and discretionary terms. For example, household utilities are a “service” but can be characterized as a mandatory expenditure. Conversely, jewelry is a “durable good” that can be considered a luxury, discretionary purchase.
To better align with this thinking, we re-segmented the government data across 28 major expense categories. We classified 11 of the 28 as non-discretionary, led by medical care, housing, food, prescription drugs and transportation expenses. In 2018, these non-discretionary areas accounted for 49.1% of disposable income. While this was modestly more favorable than in 2017 (49.3%), the consumer has been otherwise fighting an uphill battle over the last 15 years.
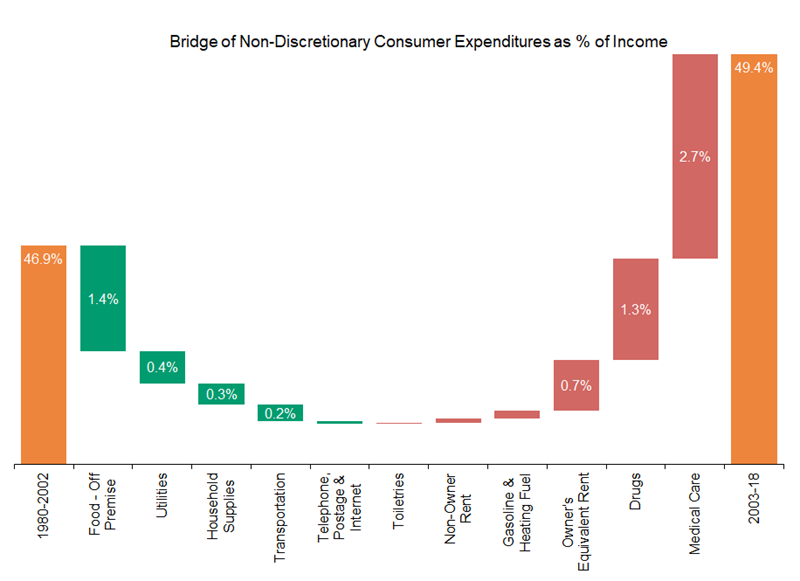
Consider that from 1980-2002, non-discretionary spending accounted for 46.7% of income, on average, with 1980 (46.9%), 1990 (46.7%) and 2000 (47.0%) not materially different. However, beginning in the early 2000s, relative stability gave way to upward expense pressure. When we compare expense burdens from 1980-2002 to 2003-18 relative to income, we find a significant increase, predominantly the result of medical care and prescription drugs.
Specifically, medical care costs increased to 14.7% of income from 12.0%. That 270 basis point increase was by far the largest for the 11 categories we isolated, with prescription drugs (up 130 basis points) and owner’s equivalent rent (up 70 basis points) the only other meaningful increases. Balancing this outsized inflation was less income being devoted to food (down 140 basis points), utilities (down 40 basis points), household supplies (down 30 basis points) and transportation (down 20 basis points).
It is likely not a significant surprise to many readers that healthcare costs are among the most onerous for the average household, but this analysis helps quantify the reduction in disposable income attributable to the net change in cumulative non-discretionary items. In our opinion, given that outsized increases in healthcare costs are likely to persist, other areas of consumer spending, including housing, have to compensate given limited disposable income flexibility for most households.
Friday, April 5, 2019 by Zelman & Associates
Filed under: AffordabilityMacro Housing
Looking for More Insightful Content?
Explore our ResearchAffordabilityApartmentsBaby BoomersBuild-For-RentBuilding ProductsConstruction LendingConsumerDemographicsEntry-LevelExisting Home SalesHome ImprovementHome PricingHomebuildingHomeownershipHousehold FormationHousingHousing StartsInstitutional InvestorsInterest RatesM&AMacro HousingManufactured HousingMillennialsMortgageMortgage RatesNew Home SalesReal Estate ServicesRefinanceSG&ASingle-Family RentalStocksStudent DebtSupplySurvey