Core Births Drop Again as Young Adults Delay Life Events
Friday, May 17, 2019 by Zelman & Associates
Filed under: Demographics
According to preliminary estimates released by the Center for Disease Control and Prevention (CDC), national births declined 1.7% in 2018 from 2017. This marks the tenth decline out of the last 11 years, leaving births 12% lower than their 2007 peak. Such a decline has not been witnessed since the 1970’s “baby bust”.
Like recent years, the national birth decline was driven by the young end of the female spectrum. Births to teenagers decreased 7.6% and births to women aged 20-24 declined 5.2%. Both of these decreases were slightly larger than in 2017. Remarkably, mothers younger than 25 accounted for 24% of births in 2018, down substantially from 36% in 2007 and 50% in 1980!
Births to women at least 25 years of age were on a solid trajectory from 2011-16, increasing each year and averaging a 1.5% annual gain. The sustained increases and continued economic momentum made 2017’s 1.2% drop very surprising at this time last year. In 2018, the decline lessened to 0.4%, a better message than last year, but still disappointing relative to the prior six years. The rate of decline for 25-29 year olds held at 2.2% while 30-34 year olds were down just 0.2%, 150 basis points better than in 2017. Births to women aged 35-39 increased 2.1%, 80 basis points stronger than in 2017.
The annual change in the number of births is actually quite small in the context of housing and purchase or rental activity. For instance, over the last four years, births to women at least 25 years old have increased by as much as 42,000 (2015) and fallen by as much as 35,000 (2017). Thus, the marginal impact on housing choices is likely very minor in any given year.
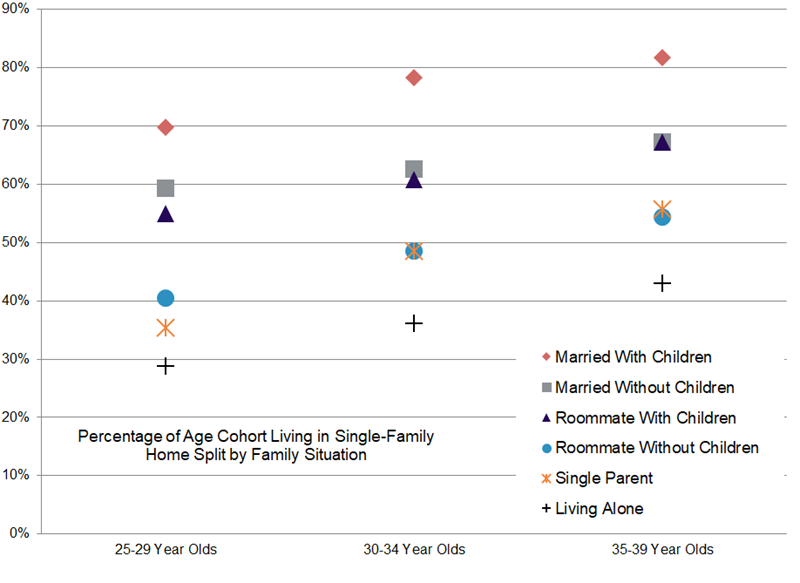
However, the accumulation of a multi-year trend bears monitoring as we can show a definitive alignment between the presence of children in a household and single-family living. In essence, children require more space and parents prefer the best school district possible, which often exists in the suburbs where single-family housing dominates.
For example, if we look only at 30-34 year old households, 36% of those living alone are in a single-family home, which rises to 48% for single parents. For the unwed living together (romantically or otherwise) without children, 49% are in single-family housing versus 61% if a child is present. Among married households, 63% of those without children live in a single-family home versus 78% that have children.
There is much speculation about what has driven the decline in 25-plus births the last two years. At this point, we have not found any glaring cause when analyzing data across race, geography or marital status, which suggests it might be an accumulation of many small factors, or simply just annual volatility that has been common over time. Either way, one cannot question that children alter housing requirements and choices. Thus, it’s an important data point to monitor in our broad-based demographic research.
Friday, May 17, 2019 by Zelman & Associates
Filed under: Demographics
Looking for More Insightful Content?
Explore our ResearchAffordabilityApartmentsBaby BoomersBuild-For-RentBuilding ProductsConstruction LendingConsumerDemographicsEntry-LevelExisting Home SalesHome ImprovementHome PricingHomebuildingHomeownershipHousehold FormationHousingHousing StartsInstitutional InvestorsInterest RatesM&AMacro HousingManufactured HousingMillennialsMortgageMortgage RatesNew Home SalesReal Estate ServicesRefinanceSG&ASingle-Family RentalStocksStudent DebtSupplySurvey