What Do Housing Unit Estimates by State Tell About Demographic Trends?
Friday, May 31, 2019 by Zelman & Associates
Filed under: DemographicsMacro Housing
As most recently discussed in December, we have a proprietary process to analyze and estimate national housing units, households and vacancies, including our unique incorporation of residential electric customer counts as an input. For 2018, we estimate that housing units increased 0.8%, trailing a 1.0% expansion in households, with the absorption of vacant units accounting for the differential.
Last week, the Census Bureau released its national and state estimates for housing units. Although the government’s estimates are as of July 2018, instead of December 2018 for our analysis, the conclusion was almost identical. The Census Bureau estimates that national housing units also increased 0.8%, with unrounded growth different by just six basis points. So far this decade, the government estimates that housing units expanded by 4.7%, slightly trailing our estimate at 5.0%.
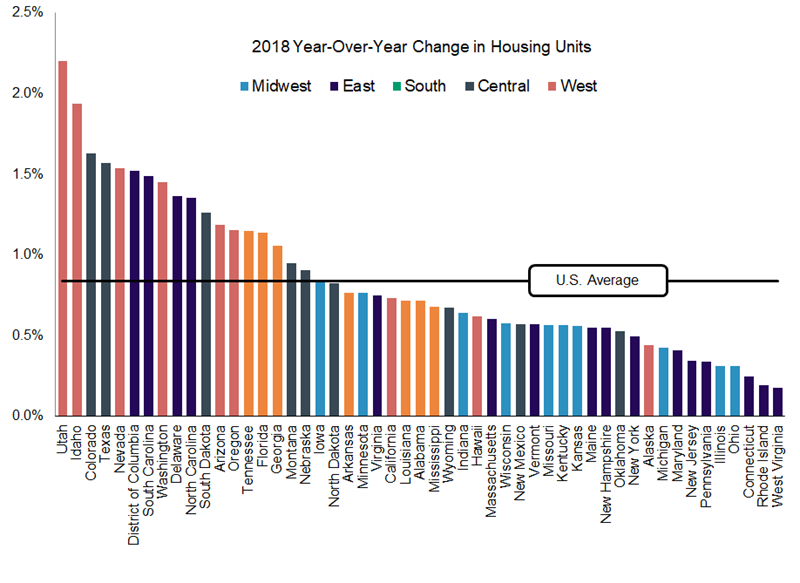
Incremental to our analysis, the government provides detail at the state level. In 2018, the most rapid increase in housing units was posted in Utah (2.2%), Idaho (1.9%), Colorado (1.6%), Texas (1.6%) and Nevada (1.5%). Housing units expanded in every state, but the softest growth was registered in West Virginia (0.2%), Rhode Island (0.2%), Connecticut (0.2%), Ohio (0.3%) and Illinois (0.3%). In general, these relative winners and losers should not surprise readers given favorable domestic population migration patterns from the Midwest and Northeast portions of the country to the South and West.
Nevertheless, in analyzing the data versus history, what did surprise us was how consistent demographic trends have been over the last two decades. For instance, the five strongest growing states in 2018 also posted above-average growth from 2010-18 and from 2000-10. In fact, of the 25 largest states as measured by housing units, 23 were either above average in all three periods analyzed or below average in all three periods analyzed. The two exceptions were: (1) Virginia, which has barely outperformed the nation from 2010-18, but underperformed from 2000-10 and in 2018; and (2) Louisiana, where the exact opposite was true. So said differently, demographic trends are fairly slow moving and it is unlikely that the migration patterns of the last two decades are going to be altered in the next five years.
Of course that does not mean that there has not been notable shifts within the winner or loser camps. If we compare state growth ranks from 2010-18 to 2000-10, North Dakota improved the most, climbing to 1st from 37th. The District of Columbia (12th from 41st), Louisiana (21st from 47th), Iowa (22nd from 39th) and South Dakota (6th from 23rd) make the next largest leaps. Outside of D.C., it is interesting that none of these areas are a focus for public homebuilders despite the growth opportunity.
Among the largest states, other noteworthy takeaways include:
- (1) California ranked 32nd so far this decade versus 26th last decade, only marginally below growth for the country as a whole in both periods, despite anti-growth policies in many areas of the state and domestic migration challenges;
- (2) Georgia (20th from 5th), Florida (18th from 6th), Arizona (14th from 2nd) and Nevada (10th from 1st) all fell meaningfully down the ranks, which can largely be attributed to the foreclosure overhang early in this decade that created excess vacancies and competition to new supply; and
- (3) in New York, Pennsylvania, Illinois, Ohio and Michigan, average housing unit growth trailed the nation by 36 basis points from 2010-18 versus 62 basis points from 2000-10, indicating that while domestic migration patterns are unfavorable, they are likely not as bad as many assume.
Friday, May 31, 2019 by Zelman & Associates
Filed under: DemographicsMacro Housing
Looking for More Insightful Content?
Explore our ResearchAffordabilityApartmentsBaby BoomersBuild-For-RentBuilding ProductsConstruction LendingConsumerDemographicsEntry-LevelExisting Home SalesHome ImprovementHome PricingHomebuildingHomeownershipHousehold FormationHousingHousing StartsInstitutional InvestorsInterest RatesM&AMacro HousingManufactured HousingMillennialsMortgageMortgage RatesNew Home SalesReal Estate ServicesRefinanceSG&ASingle-Family RentalStocksStudent DebtSupplySurvey