Zillow Has Ambitious iBuyer Goals, but Its Own Price Index Missed Market Shift
Friday, May 17, 2019 by Zelman & Associates
Filed under: Home PricingSurvey
With more than 180 million unique monthly users of Zillow’s website or mobile app, the brand is clearly a dominant force with consumers. While it has historically monetized this audience indirectly through advertising sold to real estate professionals, the ambitious shift underway is to increasingly become a consumer-direct one-stop shop for all things real estate. Its iBuyer platform, termed Zillow Offers, is the lynchpin of this vision.
Zillow Offers is currently available in ten markets and will be entering another ten markets by 1Q20. The company has outlined its target of buying 60,000 homes annually within the next 3-5 years, which would equate to roughly 1% of national existing home sales and theoretically place Zillow as the largest direct buyer and seller of real estate in the country.
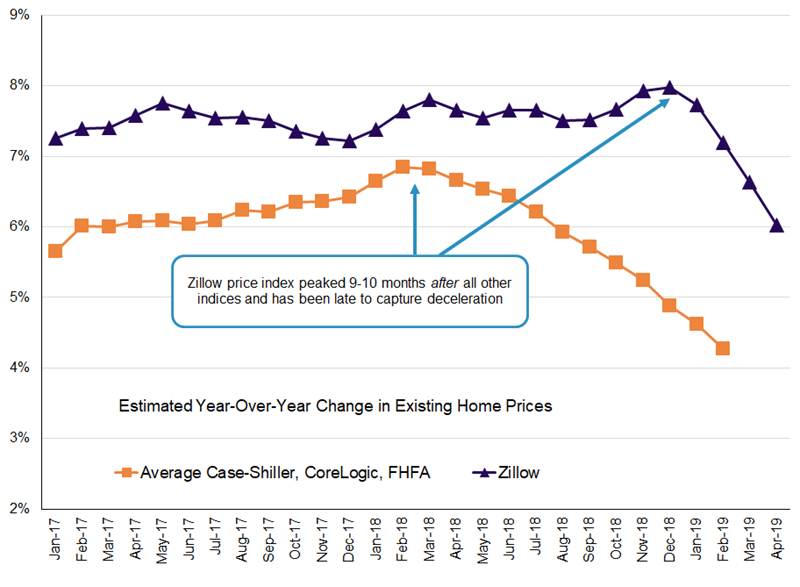
In explaining its goal, Zillow has noted that its proprietary data and market intelligence should keep it one step ahead of peers. It even calls its Zillow Home Value Indices (ZHVI) “the most accurate and timely measures of residential real estate prices in the United States.” If true, such a competitive advantage should reveal itself during unexpected shifts in demand, like last year. So how did the ZHVI do? Not well.
There are three widely-cited existing home price indices that we emphasize, which are published by Case-Shiller, CoreLogic and the Federal Housing Finance Agency. Despite slight variations in coverage and methodology, these three have been closely aligned over time. In 2017, average year-over-year appreciation was 5.8%, 5.9% and 6.6%, respectively. Comparatively, the ZHVI was up 7.5% in 2017.
In early 2018, year-over-year appreciation for all three macro indices accelerated, peaking in either February or March. The average of the three peaked in March at 6.8%, 40 basis points stronger than in December 2017. Unabated deceleration has been evident since, with the latest average in February standing at 4.3%. This deceleration matches exactly to data aggregated in our proprietary monthly Homebuilding and Real Estate Broker Surveys.
Meanwhile, the ZHVI accelerated through 2018, with a December 2018 reading of 8.1% the strongest of the year and 90 basis points better than the year-ago period. As a reminder, existing home closings growth and homebuilder order growth in 4Q18 were the weakest since 1Q14 and 1Q11, respectively. It was an extremely weak quarter for housing, and yet the ZHVI suggests price appreciation accelerated?
The latest monthly release of the ZHVI was headlined with the statement that “U.S. Home Values Fall for the First Time in Seven Years.” To us, this warning shot is about a year too late. We are certain that Zillow incorporates more than its ZHVI into its home purchase bids, but it certainly raises many questions about whether its process or data is truly better than competitors as it claims. At minimum, a ZHVI conclusion that differs from the market reality surely challenges Zillow’s credibility and creates confusion among homeowners and real estate agents.
Friday, May 17, 2019 by Zelman & Associates
Filed under: Home PricingSurvey
Looking for More Insightful Content?
Explore our ResearchAffordabilityApartmentsBaby BoomersBuild-For-RentBuilding ProductsConstruction LendingConsumerDemographicsEntry-LevelExisting Home SalesHome ImprovementHome PricingHomebuildingHomeownershipHousehold FormationHousingHousing StartsInstitutional InvestorsInterest RatesM&AMacro HousingManufactured HousingMillennialsMortgageMortgage RatesNew Home SalesReal Estate ServicesRefinanceSG&ASingle-Family RentalStocksStudent DebtSupplySurvey