A Fair Premium for New Homes Versus Existing Stock a Complicated Topic
Friday, June 14, 2019 by Zelman & Associates
Filed under: AffordabilityExisting Home SalesNew Home Sales
Earlier this week, Redfin, the technology-enabled real estate brokerage, published a study on the valuation premium associated with a garage versus a similar property without one. Across its national analysis, the average premium realized for a garage was 12%, stretching from 38% in Chicago to just 2% in Raleigh.
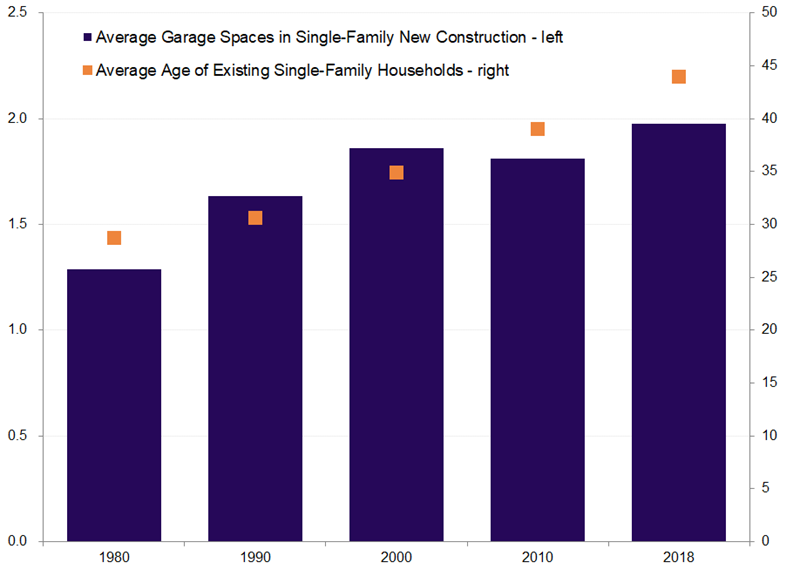
In our opinion, the study opens the door to a broader topic that we believe is often misanalysed – the appropriate premium of new construction versus existing homes. Take the example of garages. Presently, the median existing single-family home across the country was built in the early 1970s. At that time, approximately 60-65% of homes were built with a garage and the average number of spaces for all homes was roughly 1.1. Fast forward to last year, and over 92% of single-family new construction homes had a garage with approximately 2.0 spaces on average. If garages garner a premium valuation, all else equal, and they have become more common over time, then shouldn’t the valuation spread between a new and existing home similarly be widening?
This is just one small example. More broadly, the median home built in the early 1970s was 1,495 square feet in size. Since 1975, the median square footage of a new single-family home increased 31 out of 43 years, climbing 55% in total. Larger does not always imply more valuable, especially if the underlying land is smaller or in a less desirable area, but it does strongly suggest that median prices fail to paint an accurate picture.
Lastly, new construction homes offer present day design, technology, energy efficiency and building science, so the age of the existing housing stock plays a large role in determining the appropriate new construction premium. Nationally, the average existing single-family home is approximately 44 years old. That can also be thought of as the difference in age between new construction and the existing home alternative, which has been expanding from roughly 35 years in 2000 and 31 years in 1990.
Given the evolution of the United States population, this dynamic is far from equal across the country. In New York, the average single-family home is 59 years old, the highest for any state, followed by Pennsylvania (56), Rhode Island (54), Massachusetts (54) and Iowa (54). The 12 oldest states are in the Northeast or Midwest portions of the country as are 16 of the oldest 17.
Conversely, the single-family housing stock in Nevada (26), Arizona (30), Alaska (33), Georgia (34) and Florida (34) are relatively young, implying a smaller, but still significant, differential in housing quality as compared to new construction.
In 2018, the national median new home sales price as reported by the Census Bureau was 26% higher than the existing home closing price reported by the National Association of Realtors versus a 15% median for the 20 years preceding the Great Recession, which causes many industry observers to infer an affordability mismatch. We believe such a simplistic analysis overlooks the numerous nuances of comparing brand new housing supply to an increasingly dated alternative.
Friday, June 14, 2019 by Zelman & Associates
Filed under: AffordabilityExisting Home SalesNew Home Sales
Looking for More Insightful Content?
Explore our ResearchAffordabilityApartmentsBaby BoomersBuild-For-RentBuilding ProductsConstruction LendingConsumerDemographicsEntry-LevelExisting Home SalesHome ImprovementHome PricingHomebuildingHomeownershipHousehold FormationHousingHousing StartsInstitutional InvestorsInterest RatesM&AMacro HousingManufactured HousingMillennialsMortgageMortgage RatesNew Home SalesReal Estate ServicesRefinanceSG&ASingle-Family RentalStocksStudent DebtSupplySurvey