Will Housing Demand Fall Off a Cliff as the Baby Boomers Age?
Friday, June 14, 2019 by Zelman & Associates
Filed under: Baby BoomersDemographics
The Baby Boomers are commonly accepted as the generation that was born from 1946-64. For that 19-year period, there were 75.8 million births in the United States, which was an astounding 53% greater than the preceding 19 years – hence the generation’s distinction.
Given their relative size, the Baby Boomers have notoriously had a significant impact on society their entire lives, including for housing. Not coincidentally, the most housing supply created over a 19-year period in the country’s history was from 1969-87 when the edges of the Baby Boomers turned 23 years old, at an annual average of 1.965 million new construction units.
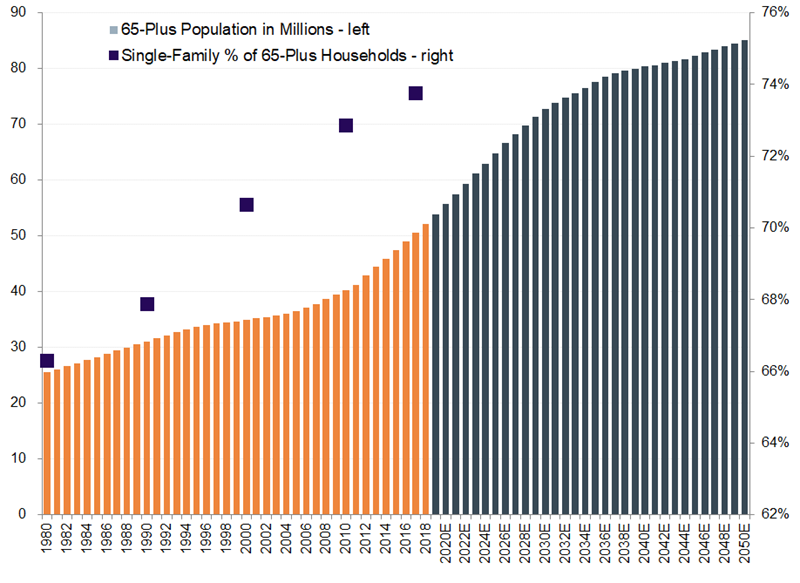
Conversely, as the Baby Boomers age and die, there is fear that housing will suffer from the absence of demand and unwanted supply. As of 2017, an above-average 74% of Baby Boomer households were single-family in nature, followed by multi-family (20%) and manufactured housing (6%). Thus, if there is a “cliff” in demand, it would disproportionately affect single-family.
Fortunately for the broader housing market, our analysis indicates that no such cliff is on the horizon, although the growth contribution from older households will slow. Expanding life expectancies are part of the reason. Consider that in 2017, mortality rates relative to 1999 were at least 20% lower for every age cohort 64 years and older. For individuals in their 70s, 2017 death rates were 26% lower than in 1999. With life expectancies projected to improve further, it should smooth the effect of Baby Boomers dying over a longer period than would otherwise have been the case.
For instance, according to projections from the Census Bureau, the 65-plus population is expected to increase every single year through at least 2060. The softest increase is projected in 2041 at 0.3%. Over the next 40-plus years, there are only five years when 65-plus population growth is weaker than for the entire adult population: 2039-43.
Contrary to popular opinion, older cohorts have been increasingly opting toward single-family living at the expense of alternatives. The 74% living in single-family homes in 2017 compares to 73% in 2010, 71% in 2000 and 68% in 1990. We attribute this to later retirements and living longer. To be sure, the Baby Boomer tailwind is easing and there will be unique challenges over the next 20-25 years as the housing stock shifts to other generations, but we expect these impacts to be quite prolonged.
Friday, June 14, 2019 by Zelman & Associates
Filed under: Baby BoomersDemographics
Looking for More Insightful Content?
Explore our ResearchAffordabilityApartmentsBaby BoomersBuild-For-RentBuilding ProductsConstruction LendingConsumerDemographicsEntry-LevelExisting Home SalesHome ImprovementHome PricingHomebuildingHomeownershipHousehold FormationHousingHousing StartsInstitutional InvestorsInterest RatesM&AMacro HousingManufactured HousingMillennialsMortgageMortgage RatesNew Home SalesReal Estate ServicesRefinanceSG&ASingle-Family RentalStocksStudent DebtSupplySurvey