Zelman Beige Book Index Provides Some Comfort Around Recessionary Fears
Friday, June 14, 2019 by Zelman & Associates
Filed under: Macro Housing
Eight times a year, the Federal Reserve publishes its Beige Book, a qualitative assessment of economic conditions around the country based on conversations with business executives. Incorporating publications dating back to 1970, we have constructed a quantified index that can be utilized to gauge the current state of the economy. Over the last ten years, our index has been 77-78% correlated to GDP growth and employment growth, with a one-quarter lead, meaning our index tends to predict the direction of these other measures reasonably well.
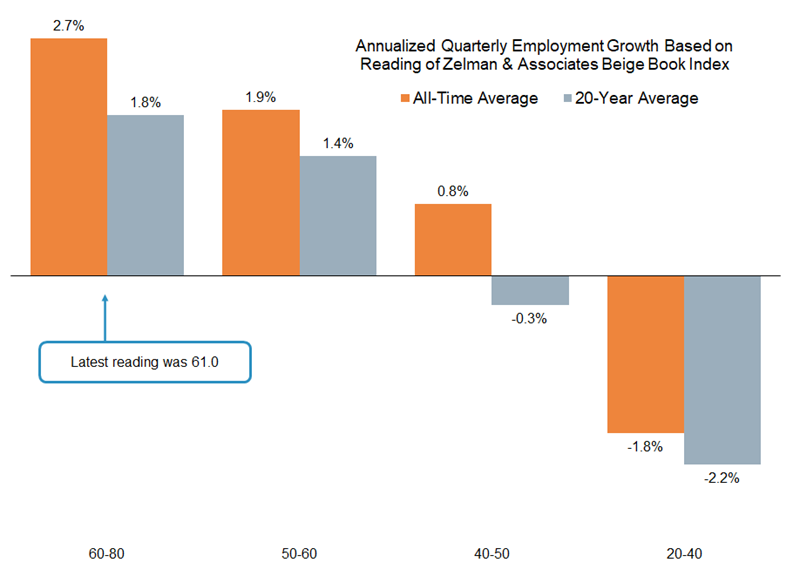
For the most recent period, our Beige Book Index registered 61.0 on a 0-100 scale, improving from 56.7 in April and 52.1 in March, which was the lowest level since September 2016 on the heels of depressed confidence in 4Q18. Although the current reading is still below the 66.6-70.6 range over the first ten months of last year, the absolute level is still highly constructive for economic activity.
To frame the connection, over the last 20 years, when our quarterly index has been in the 60-65 range, annualized employment growth has averaged 1.8%, with the worst quarter being 1.0% expansion. Over time, there has been a direct correlation as our index scales up and down. For example, when our index ranges from 60-80, annualized employment growth has averaged 2.7% since inception and 1.8% over the trailing 20 years. On the other end of the spectrum, when our index has fallen below 40, employment has contracted by 1.8% and 2.2% since 1970 and over the last 20 years, respectively.
Of course, while our index accurately assesses current economic conditions, its predictive powers are more limited as underlying business fundamentals shift. Nevertheless, as recessionary fears escalate, we can look back at the lead-up to prior economic downturns and quantify how likely it is for a recession to unfold in the near-term from a strong starting point, such as today.
For instance, in January 1989, our index stood at a healthy 60.1 before sliding through the rest of that year and all of 1990. A recession officially started in 3Q90, so it was 1.5 years after our index last reached 60.0 or better. The 2001 recession started one year after our index last achieved this threshold. In January 2006, our index was at 65.3, the last time it surpassed 60.0 ahead of the latest recession that officially began in 4Q07, a span of almost two years.
So as we consider the probability of a near-term recession, we first note that it is obviously to be determined whether the current reading above 60.0 will be the last this cycle. But even if it was and additional deterioration occurred, history would suggest that a recession would not officially start for another 1-2 years, all else equal.
Friday, June 14, 2019 by Zelman & Associates
Filed under: Macro Housing
Looking for More Insightful Content?
Explore our ResearchAffordabilityApartmentsBaby BoomersBuild-For-RentBuilding ProductsConstruction LendingConsumerDemographicsEntry-LevelExisting Home SalesHome ImprovementHome PricingHomebuildingHomeownershipHousehold FormationHousingHousing StartsInstitutional InvestorsInterest RatesM&AMacro HousingManufactured HousingMillennialsMortgageMortgage RatesNew Home SalesReal Estate ServicesRefinanceSG&ASingle-Family RentalStocksStudent DebtSupplySurvey