As “Crisis” Calls Mount, an Eye-Opening Spin on Affordability
Friday, July 12, 2019 by Zelman & Associates
Filed under: AffordabilityDemographics
From 2011-18, national existing home prices and apartment rents have climbed by 50-55% and 35-40%, respectively, easily outpacing 17% income growth for non-supervisory and production employees that represent the vast majority of the employment population. Viewed over this narrow timeframe without context easily leads one to sound the alarm on housing affordability. To be sure, many markets across the country face genuine affordable housing challenges; but, we wonder whether the national narrative has been unnecessarily exaggerated.
Recognizing that there are nuances to the calculation, it is generally accepted that a household should not spend more than 30% of income on housing costs. Unfortunately, according to the American Community Survey (ACS), 32.0% of households breached this threshold in 2017, including 49.8% for renters and 22.5% for owners. Without discounting the burdens faced by these households, there are some interesting, more positive takeaways, when comparing the data to recent history.
Starting with renters, the 49.8% share paying at least 30% of income for gross rent improved 30 basis points from 2016 and has declined in five out of the last six years. In aggregate, there has been a 400 basis point improvement from the near-term peak of 53.8% registered in 2011. Framed differently, 2017 stood as the third lowest share over the 14 years covered by the ACS.
The decline in the rent-burdened share was even more favorable for younger adult households, dropping by 510 basis points for 25-29 year olds (43.9%) and 480 basis points for 30-39 year olds (45.3%), with both measures ranking second lowest over the last 14 years.
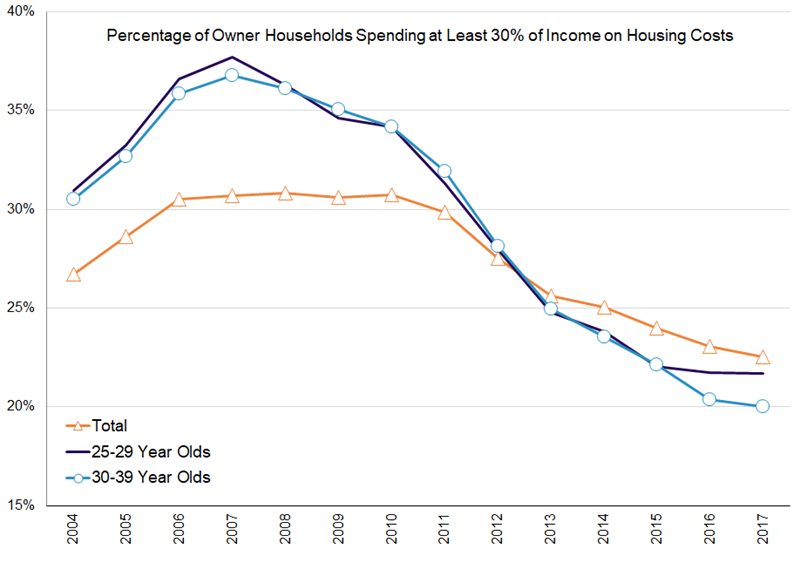
For owners, we come to an even more encouraging conclusion. The share of owner households spending at least 30% of income on their mortgage, utilities, insurance and property taxes peaked in 2008 at 30.8%. It was 30.5-30.8% for each year from 2006-10. However, it declined each of the last six years by a total of 730 basis points to 22.5%, which we attribute to stronger income growth, the benefit of lower interest rates and more responsible mortgage borrowing.
Looking at 25-29 year old owner households, only 21.7% exceeded the cost burden measure, down a greater-than-average 960 basis points from 2011 to the lowest level of our time series. While the burdened share of this age cohort was 700 basis points above average in 2007, it was 90 basis points lower than average by 2017 – a dramatic reversal. Similarly, for 30-39 year olds, the 2017 ratio of 20.0% was 1,190 basis points lower than in 2011 and the group swung from 610 basis points worse than average to 250 basis points better than average. Importantly, many of these younger owners likely purchased in recent years, so the decline in the overall cost-burden ratio would suggest that they have not stretched to achieve that milestone.
ACS data for 2018 will not be released until later this year, and it is possible that cost burdens worsened last year given the spike in interest rates. Nevertheless, we do not believe that it would reshape the broader picture. Of late, young adult homeownership rates have been rising, the entry-level price point has been the strongest portion of the housing market, and young adult cost burdens screen favorably versus recent history. Macro risk aside, how often is that narrative being told?
Friday, July 12, 2019 by Zelman & Associates
Filed under: AffordabilityDemographics
Looking for More Insightful Content?
Explore our ResearchAffordabilityApartmentsBaby BoomersBuild-For-RentBuilding ProductsConstruction LendingConsumerDemographicsEntry-LevelExisting Home SalesHome ImprovementHome PricingHomebuildingHomeownershipHousehold FormationHousingHousing StartsInstitutional InvestorsInterest RatesM&AMacro HousingManufactured HousingMillennialsMortgageMortgage RatesNew Home SalesReal Estate ServicesRefinanceSG&ASingle-Family RentalStocksStudent DebtSupplySurvey