Mischaracterization of Single-Family Investors Impacts Perceived Demand, Risk
Friday, July 12, 2019 by Zelman & Associates
Filed under: Institutional InvestorsMacro Housing
In a blog post in late June (Don’t Call it a Comeback: Housing Investors Have Been Here for Years), CoreLogic raised some eyebrows with the conclusion that “in 2018, the share of home sales bought by investors reached its highest level in two decades.” The analysis was cited as supporting evidence by The New York Times, Realtor Magazine, The Wall Street Journal and others that investors are, again, injecting risk into the single-family housing market.
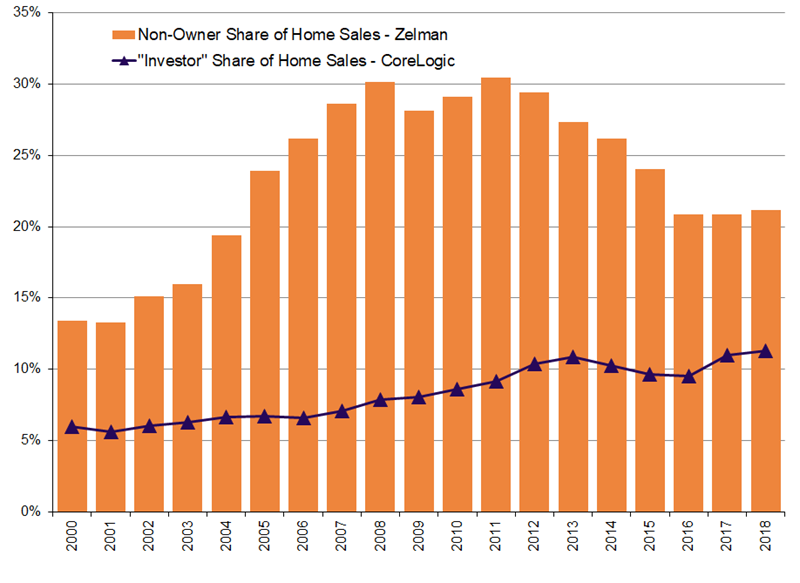
According to the study, 11.3% of home sales in 2018 were to investors, the highest since at least 1999 when the data set began. While only marginally above 2017 (11.0%) and 2013 (10.9%), this figure is 1.7 times higher than the 2004-07 average, which was arguably the biggest speculative investor bubble in generations. How can that be?
Although we view CoreLogic to be a high-quality data provider, we believe there is a definitional disconnect. The company defined “investors” as “buyers of homes that use a corporate or non-individual identifier on the deed”, such as LLC or INC. In our opinion, this is not synonymous with all investors, but rather a subsection of investors.
More importantly, we prefer to segment the market between owner-occupant purchasers – i.e. those that will be using the home as a permanent residence – and non owner-occupant purchasers. This might appear to be semantics, but it is not. By our definition, non owner-occupant buyers cover four main scenarios:
- (1) purchased for use as a vacation or second home;
- (2) purchased to hold and permanently rent;
- (3) purchased to renovate (either marginally or materially) and resell; and
- (4) purchased to hold and speculate on home price appreciation.
To estimate the share of the market attributable to owners and non-owners, we triangulate numerous data, including from our proprietary industry surveys, robust mortgage disclosures, third-party providers, government surveys and public-company results. In aggregate, we estimate that 21% of 2018 total home sales were to non owner-occupants, stable with 2017. Notably, this share has been steadily declining since reaching 30% in 2011.
Additionally, while non-owner occupant buyers are generally painted with a negative brush given perceived higher cyclical risk, we believe that the focus should instead be on the intent and leverage of the buyers. From 2004-07, sales were propelled by non owner-occupants using high leverage with a greater share of investors speculating on rising home values. This was bad. From 2012-14, cash-heavy investors that were attracted to distressed asset values helped to clear foreclosure inventory and put a floor under a downward spiral in home prices that was undercutting all homeowners. This was good.
More recently, iBuyers such as Opendoor, Offerpad, Zillow, Knock and Redfin have caught the headlines. These entities are purchasing homes directly for a convenience fee and then reselling to other owners or non-owners. Nationally, their purchase volume is immaterial (<0.5%), but in the most established market (Phoenix), their share of transactions approximates 6%.
Overall, we care less about the type of homebuyer and more about the risk associated with a buyer. At this point, we believe cyclical risk is quite low as the shortage of single-family home supply across the for-sale and for-rent markets is constrained and leverage is still responsible.
Friday, July 12, 2019 by Zelman & Associates
Filed under: Institutional InvestorsMacro Housing
Looking for More Insightful Content?
Explore our ResearchAffordabilityApartmentsBaby BoomersBuild-For-RentBuilding ProductsConstruction LendingConsumerDemographicsEntry-LevelExisting Home SalesHome ImprovementHome PricingHomebuildingHomeownershipHousehold FormationHousingHousing StartsInstitutional InvestorsInterest RatesM&AMacro HousingManufactured HousingMillennialsMortgageMortgage RatesNew Home SalesReal Estate ServicesRefinanceSG&ASingle-Family RentalStocksStudent DebtSupplySurvey