If New Home Demand is So Strong, Why Has Start Activity Been So Lackluster?
Friday, September 20, 2019 by Zelman & Associates
Filed under: Housing StartsNew Home SalesSurvey
This week, the Census Bureau reported its estimate for August single-family housing starts and permits. Positively, seasonally-adjusted starts accelerated to an annualized pace of 919,000, representing the strongest level since January and the second-highest pace over the last 15 months. Similarly, single-family permits increased 4% sequentially to an annualized pace of 866,000, marking the highest level of activity since last July. Still, year-over-year growth in both metrics in August (3% for starts, 4% for permits) remains modest and significantly lags the pace of order growth reported in our proprietary monthly survey and by select public homebuilders.
In fact, the trend has been pronounced when comparing order and start data on a year-to-date basis. Through the first seven months of the year, the Census Bureau reported new home sales were up 4%, while year-to-date single-family starts have declined 3%. While we have previously noted that government housing data often become disconnected with reality over short periods of time due to issues with sample sizes and high margins of error, in this instance, we believe the conclusion that housing start activity has deviated from order trends is correct.
In fact, our private homebuilder survey participants have posted a similar 5% year-to-date increase in orders compared to a 2% decline in starts. The data help to explain why industry participants focused on homebuilding production may not be feeling the same level of enthusiasm surrounding market conditions as those that actually sell homes. The question is whether this trend will reverse?
As implied in a stable inventory situation, homebuilders start the same number of homes that they sell. When builders are cautious about the outlook, inventory contracts and production single-family starts are lower than sales. When there is a shortfall of inventory and builders are optimistic about the future, starts exceed sales. After an unprecedented drawdown from 2008-11, starts outpaced orders each of the last seven years, including by 7% in 2018, 4% in 2017, 3% in 2016 and 5% in 2015 and 2014.
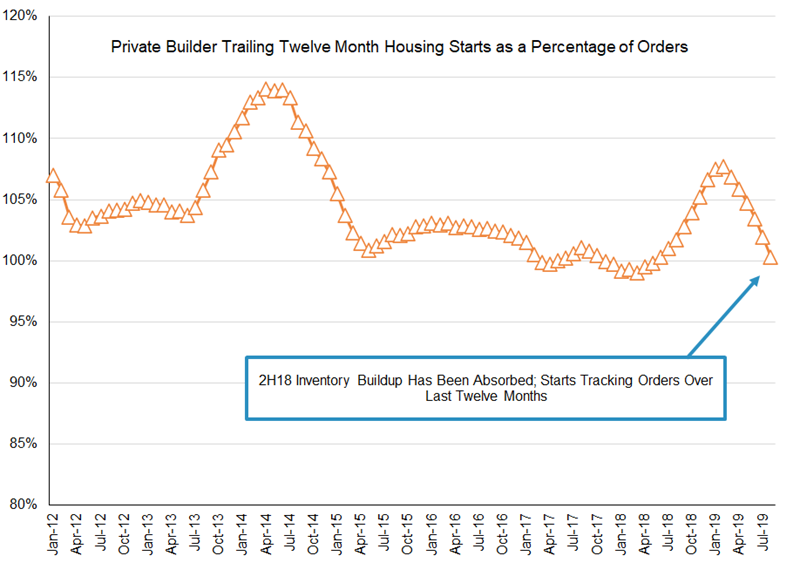
While the outsized increases in starts from 2014-17 were an intentional effort to build inventory amidst strong demand, last year’s increase was likely an unintentional dynamic as builders were locked into steady production schedules despite a slowing in underlying demand in the back half of the year. This dynamic left the market with a significant buildup of inventory to start the year, with an 11% increase in completed specs, a 10% increase in specs under construction and a 30% increase in spec homes permitted but not yet started as of January.
Positively, order activity has been solid thus far in 2019, allowing builders to work through this excess speculative inventory. In fact, we are approaching a point of equilibrium, with start activity for our contacts now exactly on par with orders over a trailing twelve-month time frame. Of note, this compares to an average 106% starts-to-orders ratio in the comparable time frame over the prior nine years, with no year coming in below 102%. Against this backdrop, we anticipate starts will meaningfully increase in the coming months, with August’s modest growth likely to be the start of a trend.
Friday, September 20, 2019 by Zelman & Associates
Filed under: Housing StartsNew Home SalesSurvey
Looking for More Insightful Content?
Explore our ResearchAffordabilityApartmentsBaby BoomersBuild-For-RentBuilding ProductsConstruction LendingConsumerDemographicsEntry-LevelExisting Home SalesHome ImprovementHome PricingHomebuildingHomeownershipHousehold FormationHousingHousing StartsInstitutional InvestorsInterest RatesM&AMacro HousingManufactured HousingMillennialsMortgageMortgage RatesNew Home SalesReal Estate ServicesRefinanceSG&ASingle-Family RentalStocksStudent DebtSupplySurvey