Home Improvements Among Pandemic Spending Winners – Can It Sustain?
Tuesday, August 11, 2020 by Zelman & Associates
Filed under: Home ImprovementMacro Housing
With four months of pandemic-affected spending in the books, we analyzed hundreds of categories estimated by the Bureau of Economic Analysis to quantify many of these moving pieces. We segmented the entirety of consumer expenditure data into four classifications:
- Mandatory: At 48% of consumer spending, mandatory expenditures include shelter, utilities, food, medication and household supplies.
- Need-to-Normalize: Expenditures on healthcare, cars, clothing, education and personal services account for 32% of total consumer spending, and are largely unavoidable, but have been partially deferred during the crisis.
- Pandemic Gainer: Representing 8% of consumer spending, discretionary areas such as computers, electronics, home furnishings, home improvements, recreational goods, jewelry and appliances have been beneficiaries of the pandemic.
- Pandemic Loser: At 12% of expenditures, Pandemic Losers are categories that consumers have deemphasized, either by want or requirement, such as recreational services (movies, sporting events, amusement parks), air travel, hotel accommodations and other forms of transportation.
In January and February, limited differentiation was evident for the four classifications, with all posting roughly 4-5% year-over-year growth. However, the pandemic effects started to materialize in March, with Mandatory spending modestly accelerating, but all other categories weakening. By April, all four areas weakened from March, led by the Pandemic Losers. By June, Pandemic Gainers were up 14% year over year, clearly benefiting from a 46% drop in Pandemic Losers, and likely stimulus.
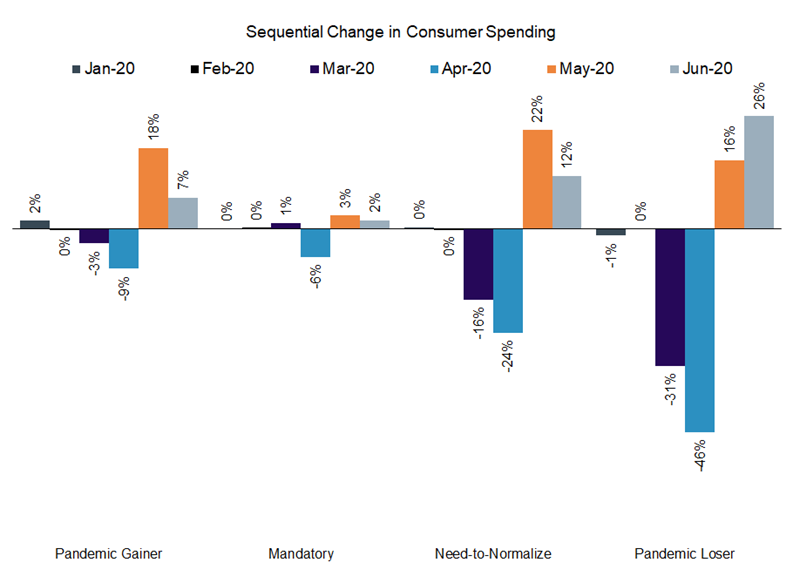
Interestingly, as shown in the below exhibit, Need-to-Normalize posted the strongest seasonally-adjusted sequential increase in spending (22%) in May as deferred spending from April was unleashed with easing of stay-at-home orders. In June, seasonally-adjusted sequential growth was led by Pandemic Losers (26%), followed by Need-to-Normalize (12%), Pandemic Gainers (7%) and Mandatory (2%).
Said differently, so long as COVID-19 remains front and center, we expect a preference for Pandemic Gainers over Pandemic Losers. However, we also note that the 10% year-over-year decline in Need-to-Normalize as of June is a gap that largely has to close; consumers are showing an inclination to return to Pandemic Losers when allowed; and stimulus funds are unlikely to be as significant moving forward, potentially challenging the ability of Pandemic Gainers to maintain outsized growth, especially if virus fears fade, either from a successful vaccine or other reasons.
Tuesday, August 11, 2020 by Zelman & Associates
Filed under: Home ImprovementMacro Housing
Looking for More Insightful Content?
Explore our ResearchAffordabilityApartmentsBaby BoomersBuild-For-RentBuilding ProductsConstruction LendingConsumerDemographicsEntry-LevelExisting Home SalesHome ImprovementHome PricingHomebuildingHomeownershipHousehold FormationHousingHousing StartsInstitutional InvestorsInterest RatesM&AMacro HousingManufactured HousingMillennialsMortgageMortgage RatesNew Home SalesReal Estate ServicesRefinanceSG&ASingle-Family RentalStocksStudent DebtSupplySurvey