High-Level Decennial Census Results Revealed – What Did We Learn?
Monday, April 26, 2021 by Dennis McGill
Filed under: DemographicsMacro Housing
Not surprisingly, national population growth was weak for the decade, totaling just 7.4% and registering as the second slowest decade in history, only narrowly ahead of 7.3% in the 1930s. However, this was actually slightly stronger than 6.5% implied by the Census Bureau’s annual population estimates. The cause of the upside and in what part of the decade it fell will likely not be clear for some time. Nevertheless, given solid documentation around births and deaths, we suspect that stronger immigration than previously uncovered is the best explanation.
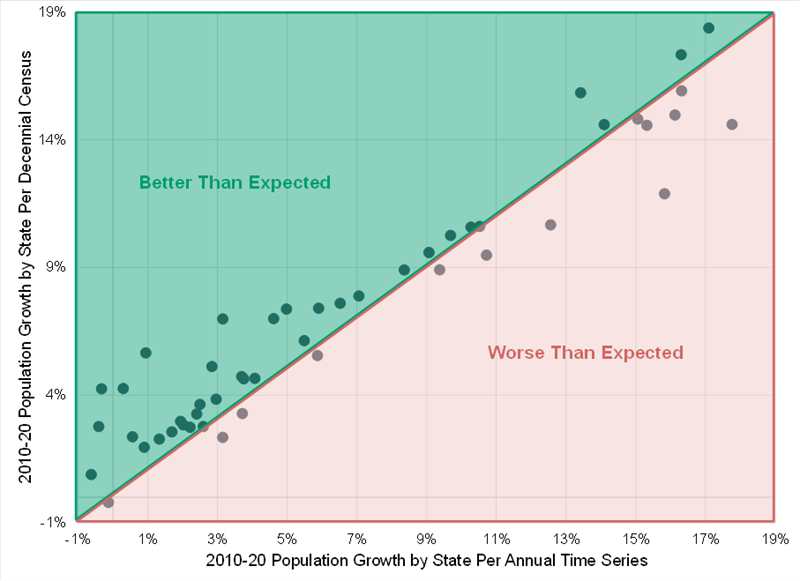
At the state level, the most rapid population growth was largely as anticipated, with UT, ID, TX, ND, NV, CO, DC, WA, FL and AZ representing the top ten as preliminary figures indicated. However, growth was slower than the annual data implied in six of these ten, led by AZ (11.9% versus 15.8%), DC (14.6% versus 17.8%) and NV (15.0% versus 16.1%).
Conversely, perhaps the most unexpected outcome was that the states most associated with out-migration actually surpassed preliminary estimates most frequently, including NJ (5.7% versus 0.9%), NY (4.2% versus down 0.3%), RI (4.3% versus 0.3%) and VT (2.8% versus down 0.4%). Of the 21 states that did better than was anticipated by at least 100 basis points, 15 were in the bottom half of estimated state-level population growth.
Far more detail will be released by the Census Bureau later this year and beyond that will be quite fruitful for demographic analyses that are critical to the longer-term outlook for housing. That said, for now, the government might have created more questions than provided answers.
Monday, April 26, 2021 by Dennis McGill
Filed under: DemographicsMacro Housing
Looking for More Insightful Content?
Explore our ResearchAffordabilityApartmentsBaby BoomersBuild-For-RentBuilding ProductsConstruction LendingConsumerDemographicsEntry-LevelExisting Home SalesHome ImprovementHome PricingHomebuildingHomeownershipHousehold FormationHousingHousing StartsInstitutional InvestorsInterest RatesM&AMacro HousingManufactured HousingMillennialsMortgageMortgage RatesNew Home SalesReal Estate ServicesRefinanceSG&ASingle-Family RentalStocksStudent DebtSupplySurvey