New Data from Census Confirms Weakest Household Growth in Nation’s History Last Decade
Thursday, August 12, 2021 by Dennis McGill
Filed under: DemographicsHousehold FormationMacro Housing
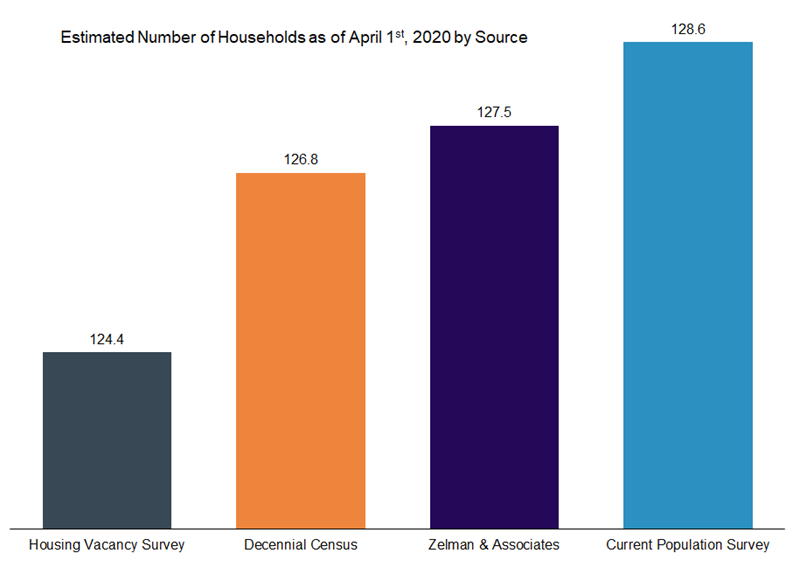
According to the results, there were 126.8 million households as of April 1st, 2020, representing an 8.7% increase from 2010, or an additional 10.1 million households. This marked the slowest decade of household formation in the country’s history, decelerating from a 10.7% increase from 2000-10, which was the previous record low. Although household growth outpaced population growth (7.4%) for at least the 13th consecutive decade, owing to shifting demographics, both pieces of the puzzle are suffering from decelerating population growth overall.
We view the Decennial Census to be the best benchmark for households given its 100% sample size and relative reliability versus the downside of volatility and restatements that are common in other Census Bureau surveys, such as the Housing Vacancy Survey (HVS) or the Current Population Survey (CPS). Through our Turning the Lights on Household Formation report series, we have attempted to bridge the various moving pieces of housing supply and demand since the 2010 Census. As first published in June 2020, we estimated that the 2020 Decennial Census would show 127.5 million households. Thus, our estimate finished within 0.5% of the published government data. In contrast, the comparable metric published by the HVS and CPS was 124.4 million and 128.6 million, respectively, equating to a margin of error 3-4 times that of our analysis.
At the state level, the most robust household growth for the decade was posted in Utah (20%), Texas (18%), Nevada (17%), Idaho (17%) and Florida (15%) – the same five states that we pegged as the strongest in our previously-published research. However, the deceleration seen for the nation as a whole was also evident across the vast majority of the country. For instance, comparing 2010-20 household growth to that from 2000-10, 42 states posted deceleration, with the eight exceptions (RI, ND, MA, MI, NY, NJ, LA and OH) surprisingly overlapping some of the slower growth states in the country.
While we expect to uncover many interesting facts and takeaways relevant to the housing market as we dig deeper into the troves of information provided by the Decennial Census, thus far, we are pleased that our demographic research has appropriately captured the core underlying pillar of household formation.
Thursday, August 12, 2021 by Dennis McGill
Filed under: DemographicsHousehold FormationMacro Housing
Looking for More Insightful Content?
Explore our ResearchAffordabilityApartmentsBaby BoomersBuild-For-RentBuilding ProductsConstruction LendingConsumerDemographicsEntry-LevelExisting Home SalesHome ImprovementHome PricingHomebuildingHomeownershipHousehold FormationHousingHousing StartsInstitutional InvestorsInterest RatesM&AMacro HousingManufactured HousingMillennialsMortgageMortgage RatesNew Home SalesReal Estate ServicesRefinanceSG&ASingle-Family RentalStocksStudent DebtSupplySurvey