Share of Homebuyers With Weaker Credit Profiles Bouncing Back, But Not Everywhere
Thursday, February 3, 2022 by Kevin Kaczmarek
Filed under: AffordabilityDemographicsHomeownershipMacro HousingMortgageMortgage RatesNew Home Sales
As we noted in our latest mortgage survey and November newsletter, lower-quality credits have been gaining share in the home purchase market and likely will continue to do so, barring a sudden resurgence in refinance activity. Some may ask how this can be the case given daily media headlines describing red-hot housing markets and affordability crises. Before addressing that, we should examine some facts.
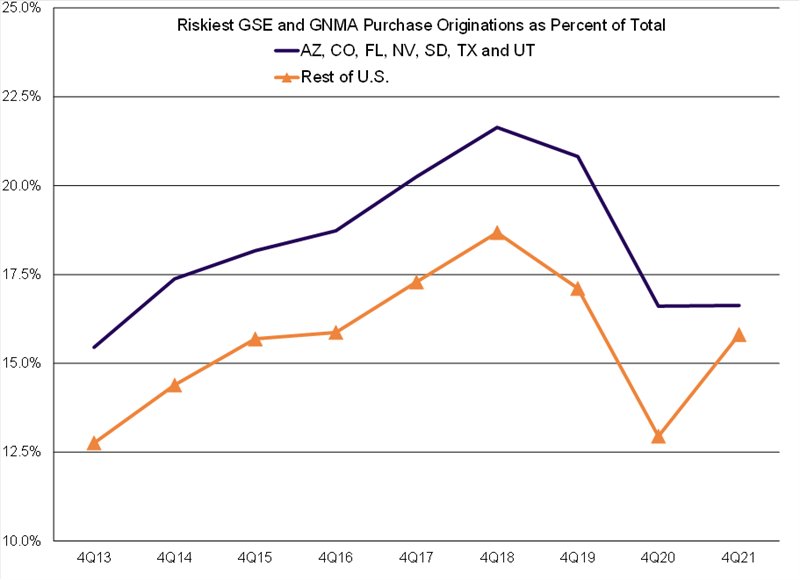
First, our proprietary 0-100 index measuring the credit quality of purchase mortgage applicants, where 100 indicates extremely high credit quality, declined to 59 last month, down four points year over year and equal to the eight months preceding COVID-related shutdowns, indicating that on a national scale the environment has mostly normalized. Looking at this a second way, we segment securitized GSE and GNMA purchase originations, which include roughly three-quarters of all purchase originations, by risk as measured by credit score, debt-to-income ratio (DTI) and loan-to-value ratio (LTV). We found that the riskiest cohort, or those with some combination of lower credit scores, higher DTIs and higher LTVs, comprised 16.0% of GSE and GNMA securitized purchase originations in 4Q21, up 210 basis points from the year-ago level – which itself was a seven-year low – albeit still well below the pre-COVID 4Q19 level of 18.1%.
The share gain of lower-quality credits may appear inconsistent with myriad reports of ultra-competitive housing markets characterized by bidding wars, aggressive demand from investors, very low for-sale inventory levels and affordability challenges where only the higher-income, well-capitalized borrowers are able to close on home purchases. Slicing the data by geography helps bridge these two seemingly contradictory states of affairs. More specifically, looking at a state-level breakout, the aforementioned share of riskiest purchase originations in 4Q21 increased by at least 50 basis points in 43 states, with the latter accounting for 73% of all GSE and GNMA purchase originations in 2021.
The seven states that did not show meaningful increases in the share of weaker credits were AZ, CO, FL, NV, SD, TX and UT. Perhaps not surprisingly, these states are among the most competitive housing markets, stand near the top of the list of COVID-driven destinations and are often the subject of the aforementioned media headlines. Using home price appreciation as a proxy for competition, three of these seven states stood amongst the four highest in terms of year-over-year home price appreciation as of November and the average year-over-year appreciation of the seven stood at 22%, 700 basis points above that of the remaining 43 states. In short, while lower-quality credits may struggle to close on homes in some regions, their prospects are improving substantially across the vast majority of the country.
Thursday, February 3, 2022 by Kevin Kaczmarek
Filed under: AffordabilityDemographicsHomeownershipMacro HousingMortgageMortgage RatesNew Home Sales
Looking for More Insightful Content?
Explore our ResearchAffordabilityApartmentsBaby BoomersBuild-For-RentBuilding ProductsConstruction LendingConsumerDemographicsEntry-LevelExisting Home SalesHome ImprovementHome PricingHomebuildingHomeownershipHousehold FormationHousingHousing StartsInstitutional InvestorsInterest RatesM&AMacro HousingManufactured HousingMillennialsMortgageMortgage RatesNew Home SalesReal Estate ServicesRefinanceSG&ASingle-Family RentalStocksStudent DebtSupplySurvey