How Quickly Could “No Inventory” Narrative Change?
Thursday, May 26, 2022 by Ryan McKeveny
Filed under: Existing Home SalesHomeownership
Instead, outsized demand and a historically-fast pace of listings going under contract since the initial COVID rebound has been the clear driver of depleted inventory levels. Existing home sales in 2020 – or the flow out of inventory – increased 6% from 2019 and were highest since 2006, before jumping an additional 9% in 2021. According to both NAR and Redfin data, the incremental rise in existing home sales since 2019 was slightly greater than the absolute declines in active inventory, with the increase in new listings over this timeframe actually acting as a relative buffer against even greater inventory pressure.
Looking forward, we expect this relationship to hold, but in the opposite direction – with active inventory set to rise as demand and sales activity retreats. In fact, movement in this direction has already started as seasonally-adjusted existing home sales have weakened for three straight months. Meanwhile, single-family resale inventory in April was up 12% sequentially, the fourth largest increase for the month of April in the 40 years of available data. This followed March’s 9% sequential increase, which was the third largest expansion for the month over this timeframe. As a result, the two-month increase of 23% was the largest February to April expansion since at least 1983.
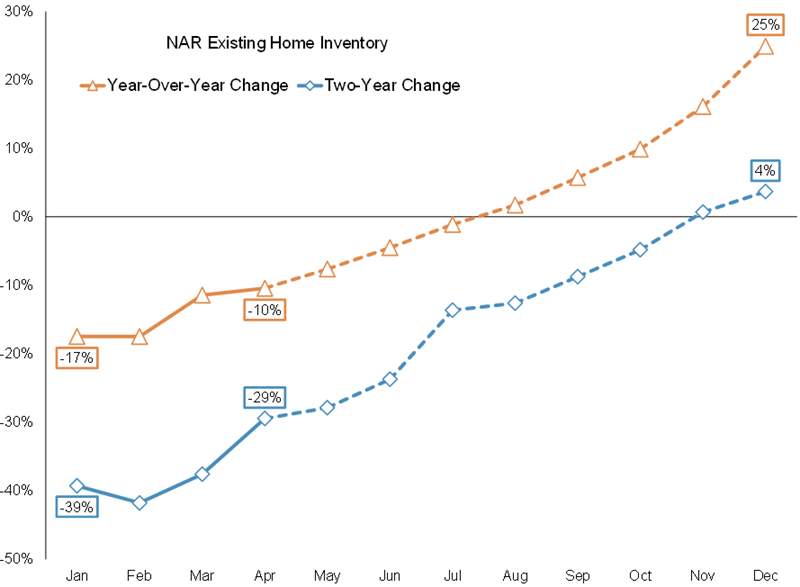
While data from Realtor.com suggests that national resale inventory is already up on a year-over-year basis, the inflection in the NAR’s data is likely several months away. More important than the exact timing of the inflection is that after the reversion higher occurs, the rate of expansion could accelerate rapidly as growth will be coming from record low levels. As an example, if we simplistically assume that existing home sales hold steady at April’s seasonally-adjusted annualized pace and that monthly new listings remain flattish with year-ago trends, then the NAR’s inventory data would inflect positively in August before accelerating to 25% year-over-year growth by December. Naturally, if home sales weaken further, or if the pace of new listings increases, then the inflection could be sooner and the rate of inventory accumulation more extreme; whereas if demand reaccelerates or sellers retreat from the market, for-sale inventory could remain depressed.
To be sure, even if the aforementioned scenario played out by December 2022, the absolute level of inventory would be up just 4% relative to December 2020 and still 21% below December 2019. While the rhetoric would likely remain that inventory is still historically tight despite large year-over-year increases, similar views were pronounced in the mid-2000s when solace was found in the fact that months’ supply of inventory reached its lowest level ever in January 2005 up to that point. Overall, alongside our expectation for a multi-year decline in existing home sales, we suspect that inventory will accumulate at a faster pace than most anticipate given the widespread perception of a housing shortage. Combined with historically-weak affordability, we expect declining demand and rising supply to culminate in home price pressure in 2023-24.
Thursday, May 26, 2022 by Ryan McKeveny
Filed under: Existing Home SalesHomeownership
Looking for More Insightful Content?
Explore our ResearchAffordabilityApartmentsBaby BoomersBuild-For-RentBuilding ProductsConstruction LendingConsumerDemographicsEntry-LevelExisting Home SalesHome ImprovementHome PricingHomebuildingHomeownershipHousehold FormationHousingHousing StartsInstitutional InvestorsInterest RatesM&AMacro HousingManufactured HousingMillennialsMortgageMortgage RatesNew Home SalesReal Estate ServicesRefinanceSG&ASingle-Family RentalStocksStudent DebtSupplySurvey