Slowing Demand Driving For-Sale Inventory Higher Despite Decline in New Listings
Wednesday, October 12, 2022 by Kevin Kaczmarek
Filed under: AffordabilityHome PricingReal Estate Services
CoreLogic recently released detailed home price appreciation data for the month of August that showed prices declined on a sequential basis for the second straight month. The 1.2% decline over the two-month period is the first nationwide home price reversal since the Great Financial Crisis. As a reminder, the aforementioned pricing data relates to home closings – with the first month of price decline in July largely related to contract signings from May and June.
That being said, home price appreciation data from individual markets showed wide disparities. For instance, King County in Seattle (down 6.1%) and Santa Clara County, CA (down 7.7%) saw prices decline from June through August, but Charleston, SC (up 4.1%) and Westchester County, NY (up 3.9%) witnessed increases. In fact, for the two-month period across more than 1,100 counties, the bottom quartile declined an average of 2.5% while the top quartile increased 2.7%.
Overall, the largest home price declines are corresponding with markets experiencing sharper declines in demand, as the supply of new listings actually declined fairly uniformly across the country in recent months. More specifically, new listings in July and August declined 9-11% year over year across each of the four aforementioned quartiles and also stood 9-12% below the average over the previous five years.
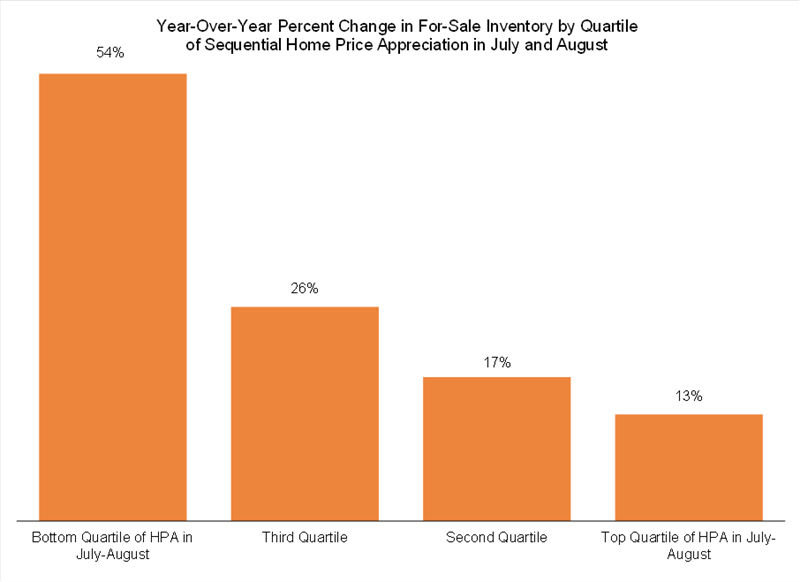
In those markets with the largest price declines, the slowdown in demand has meaningfully outpaced the lower supply of new listings, driving for-sale inventory much higher. In fact, the counties in the bottom quartile of home price changes in July and August saw for-sale inventory increase 54% year over year in aggregate in August versus a much-lower 13% increase for counties experiencing the strongest home price growth. Overall, as we have been reiterating for some time, the low number of for-sale listings in recent years has been more of a function of elevated sales activity, not a shortage of supply, as the number of new listings has been relatively stable, and now that demand has begun to wane, the stock of homes listed for sale is increasing accordingly.
Wednesday, October 12, 2022 by Kevin Kaczmarek
Filed under: AffordabilityHome PricingReal Estate Services
Looking for More Insightful Content?
Explore our ResearchAffordabilityApartmentsBaby BoomersBuild-For-RentBuilding ProductsConstruction LendingConsumerDemographicsEntry-LevelExisting Home SalesHome ImprovementHome PricingHomebuildingHomeownershipHousehold FormationHousingHousing StartsInstitutional InvestorsInterest RatesM&AMacro HousingManufactured HousingMillennialsMortgageMortgage RatesNew Home SalesReal Estate ServicesRefinanceSG&ASingle-Family RentalStocksStudent DebtSupplySurvey