Fighting Over a Melting Ice Cube?
Friday, April 29, 2022 by Dennis McGill
Filed under: DemographicsMacro Housing
Isolating the top 50 markets by population size, the growth leaders for the most recent year would surprise few, including Austin (2.3%), Raleigh (2.0%), Jacksonville (1.6%), Phoenix (1.6%) and San Antonio (1.6%). Growth in these five markets, and 13 other markets, easily outperformed the national average not only in the most recent year, but every year last decade. Also to no one’s surprise, 14 out of the top 50 markets posted below-average growth in each of the past 11 years, including markets such as metro New York, Los Angeles, Chicago, Pittsburgh, Detroit and Cleveland. In other words, predicting relative population trends across geographies should not be very difficult.
But what if we compared markets to their own history? If the national demographic trajectory is indeed downward sloping, as we believe it is, shouldn’t the trend in growth be more relevant? Consider that from July 2016 to July 2020, a period largely unaffected by the pandemic, population growth for the top 50 markets averaged 0.58%, more than 40% slower than 0.98% for the first six years of the decade. Importantly, deceleration was evident in 44 out of the 50 markets. The exceptions were Las Vegas, Jacksonville, Phoenix, Cincinnati, Indianapolis and Tampa. The deceleration continued in the most recent year, with 48 out of 50 markets expanding at a slower pace than the final four years of last decade. Few would guess the two exceptions that expanded at a faster pace than historically: Hartford and the Inland Empire.
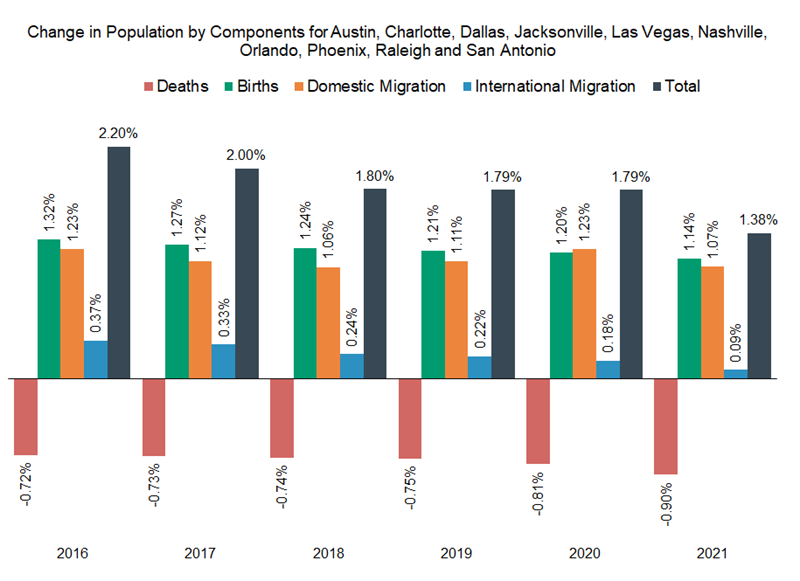
To be fair, the greatest deceleration was in several gateway cities that catch many headlines for outmigration, including the Bay Area, San Jose, metro New York, Washington D.C. and Los Angeles. But Orlando, Las Vegas, Southeast Florida, Denver and Salt Lake City (cities frequently identified in the headlines as booming over the past few years) were also among the 15 markets that decelerated the most. Framed differently, if we aggregated Austin, Phoenix, Raleigh, Jacksonville, Tampa, Las Vegas, Charlotte, San Antonio, Nashville and Dallas – the ten markets out of the top 50 that benefited the most from domestic migration last year – population growth of 1.38% was still 25% slower than the preceding four years.
To be sure, excessive deaths and depressed immigration related to the pandemic are temporary headwinds that we expect to reverse, modeling 0.4% annual population growth for the country over the final eight years of this decade. Even still, we believe that real estate developers are tethered to historical population growth rates that will prove extremely challenging to achieve for almost all markets due to the aging population, weak fertility rates and an immigration policy that lacks clear growth ambitions.
Friday, April 29, 2022 by Dennis McGill
Filed under: DemographicsMacro Housing
Looking for More Insightful Content?
Explore our ResearchAffordabilityApartmentsBaby BoomersBuild-For-RentBuilding ProductsConstruction LendingConsumerDemographicsEntry-LevelExisting Home SalesHome ImprovementHome PricingHomebuildingHomeownershipHousehold FormationHousingHousing StartsInstitutional InvestorsInterest RatesM&AMacro HousingManufactured HousingMillennialsMortgageMortgage RatesNew Home SalesReal Estate ServicesRefinanceSG&ASingle-Family RentalStocksStudent DebtSupplySurvey