Foreclosure Tides are Rising, But Far from a Wave
Monday, June 8, 2026 by Ryan McKeveny
Filed under: Existing Home SalesHomeownershipMortgageMortgage Rates
To be sure, stresses are not evenly distributed across the mortgage market. Per data from the Mortgage Bankers Association, conventional (GSE) borrowers remain in good shape, with only 0.4% of conventional loans in foreclosure and 30-plus day delinquencies at just 2.8%, well below their long-term average. On the other hand, FHA, which accounts for roughly 15% of annual originations, is the clear pressure point. As of 1Q26, the 30-plus day delinquency rate on FHA loans reached 11.9%, 300 basis points above the long-term average - reflecting strain on borrowers who often have smaller down payments, thinner savings cushions, and less flexibility when monthly budgets tighten. Directionally similar, foreclosures in process on FHA loans equaled 1.6% in 1Q26, up 40 basis points sequentially and 70 basis points year over year, though still 20 basis points below the long-term average. While divergence in mortgage performance across loan types is normal given FHA’s low down payment requirements and more lenient underwriting, it does reinforce the K-shaped nature of the housing market, like the economy overall.
Back to the big picture, a key factor lessening the risk of a foreclosure wave, at least for now, is the historically-low share of negative equity loans – limiting the risk of “strategic defaults,” which proliferated during the GFC when some borrowers had a financial incentive to stop paying a mortgage and let a home go into foreclosure. As of March 2026, only 1.9% of outstanding mortgages were underwater. While up 16 basis points from the all-time low in June 2024, this was down 16 basis points year over year as home prices have continued to creep higher nationally. For context, the share of negative equity loans averaged 4% in 2019, and 9% since CoreLogic’s data series began in 2009 (led by a 24-26% share in 2009-2011). Ultimately, most homeowners still have an equity cushion, even in markets where prices have softened over the last 1-2 years, resulting in more options for at-risk borrowers, including selling before foreclosure becomes unavoidable.
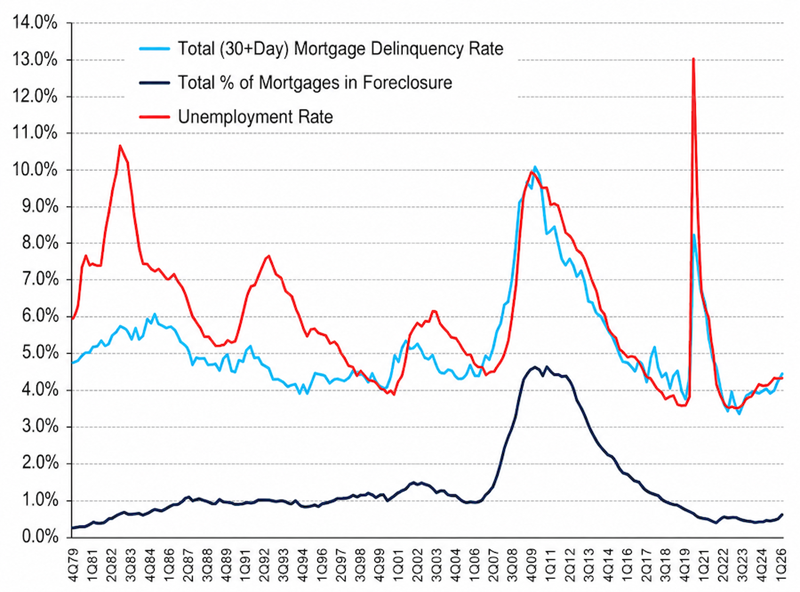
As such, employment trends (job losses) should remain the primary driver of future mortgage delinquency/foreclosure risk, as is historically the case. While what the future may hold for the job market will likely remain uncertain as economic and AI-related dynamics unfold, we note that since 1980, there has been a 74% correlation between the mortgage delinquency rate and the unemployment rate.
Monday, June 8, 2026 by Ryan McKeveny
Filed under: Existing Home SalesHomeownershipMortgageMortgage Rates
Looking for More Insightful Content?
Explore our ResearchAffordabilityApartmentsBaby BoomersBuild-For-RentBuilding ProductsConstruction LendingConsumerDemographicsEntry-LevelExisting Home SalesHome ImprovementHome PricingHomebuildingHomeownershipHousehold FormationHousingHousing StartsInstitutional InvestorsInterest RatesM&AMacro HousingManufactured HousingMillennialsMortgageMortgage RatesNew Home SalesReal Estate ServicesRefinanceSG&ASingle-Family RentalStocksStudent DebtSupplySurvey